Story Highlights
- 35% say they are spending less, down from a 57% high eight years ago
- Among those spending more, majority say it is only temporary
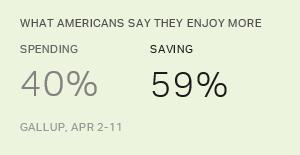
- 59% say they are the type of person who enjoys saving more than spending
WASHINGTON, D.C. -- Asked about their spending habits, Americans are as likely to say they are spending the same amount as they used to (35%) as to say they are spending less (35%). Slightly fewer, 30%, report spending more. This pattern continues a marked shift from during and just after the recession, when at least half of Americans said they were spending less.
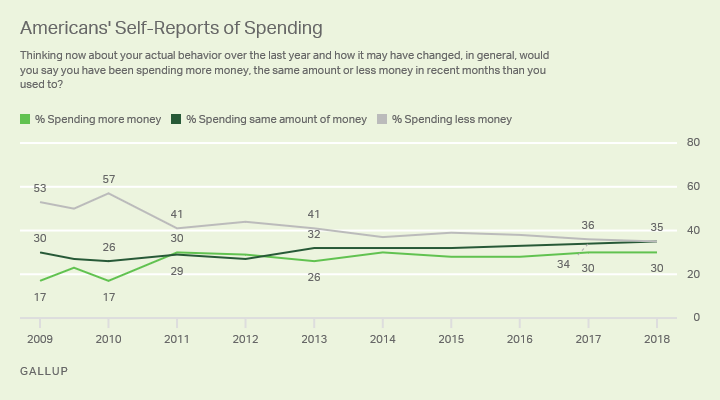
This year marks the first time since Gallup began asking the question in 2009 that the "spending the same" percentage matches "spending less." This reflects minor shifts from last year's update, but is dramatically different from 2010, when 57% of Americans said they were spending less -- dwarfing the percentage choosing the other two options.
Americans' reluctance to say they are spending more may partially reflect a desire to view or present themselves as fiscally prudent. Even among those who say they are spending more, the majority say in a follow-up question that this is only a temporary state of affairs. By contrast, the larger group saying they are spending less tilts strongly toward claiming that this is a new, normal pattern.
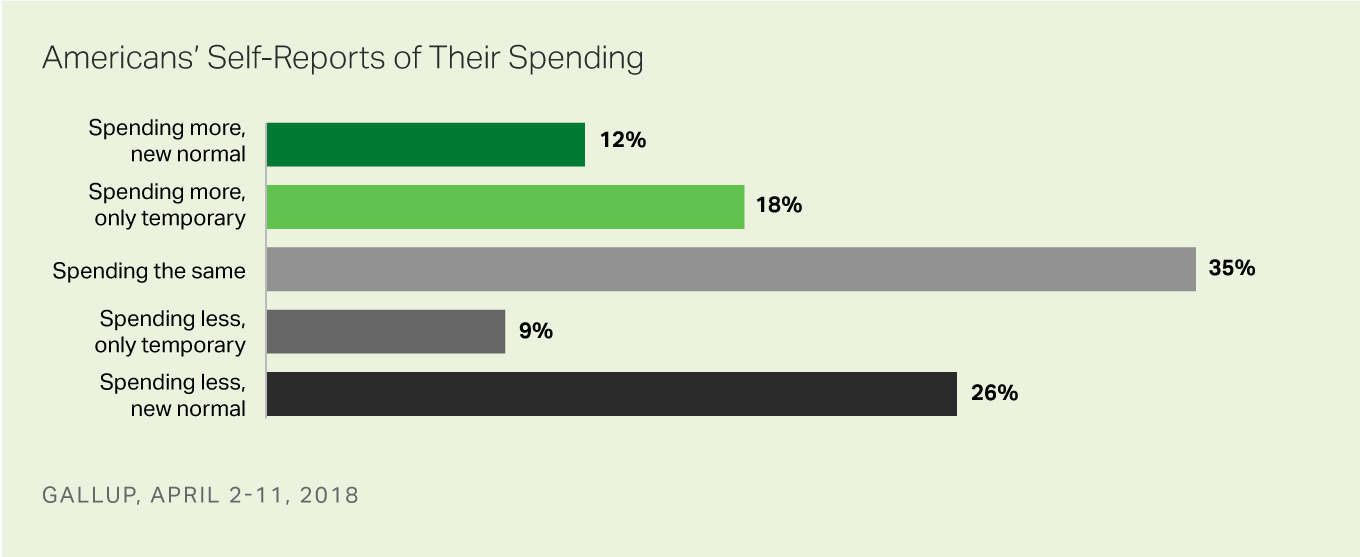
These basic tendencies -- for Americans who say they are spending more to view it as temporary, but for those who are spending less to say it is a more permanent change -- have been evident over the past 10 years, even as the overall spending more/spending less percentages have changed.
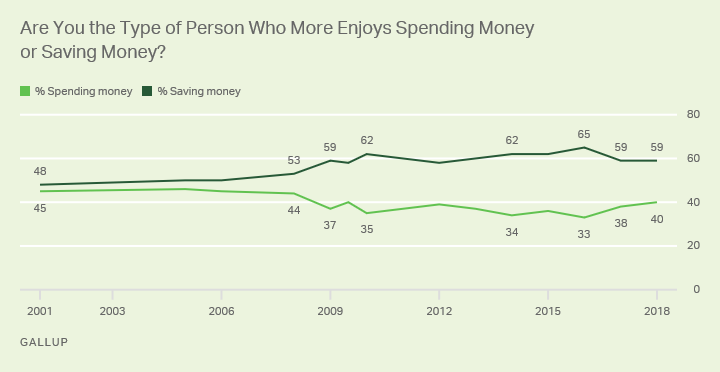
More evidence that Americans like to view themselves as fiscally prudent comes from a separate question asking them if they see themselves as the type of person who enjoys saving or spending. Almost six in 10 (59%) say they enjoy saving more, compared with 40% who say they enjoy spending.
The gap between these saving and spending groups has closed marginally over the past two years, but since 2009, Americans have consistently opted to describe themselves as savers rather than spenders.
These views were much more evenly balanced before the recession. In 2001, for example, 48% of Americans said they enjoyed saving more and a similar 45% enjoyed spending more.
Implications
Government statistics and other studies show that Americans' actual spending has generally risen in the years since the recession, and this is reflected in Americans' general pattern of spending reports. But people apparently continue to want see themselves as fiscally responsible, to some degree. Even now, Americans who admit that they are spending more over the past several months are more likely to claim this is only temporary, rather than their new normal, while those who say they are spending less believe it is permanent. And Americans' predilection to say they enjoy saving more than spending, which rose dramatically between the period before and the period just after the recession, has remained in place, even as the economy has improved.
In light of these findings, retailers should note that they can connect with consumers' idealized view of themselves by offering discounts, sales and other mechanisms that reinforce frugality. A recent Wall Street Journal report indicated that actual spending is down in the first months of this year, puzzling analysts but serving as a reminder that Americans' mental reservations about spending may hinder a return to the more free-wheeling spending days of the past.
Survey Methods
Results for this Gallup poll are based on telephone interviews conducted April 2-11, 2018, with a random sample of 1,015 adults, aged 18 and older, living in all 50 U.S. states and the District of Columbia. For results based on the total sample of national adults, the margin of sampling error is ±4 percentage points at the 95% confidence level. All reported margins of sampling error include computed design effects for weighting.
Each sample of national adults includes a minimum quota of 70% cellphone respondents and 30% landline respondents, with additional minimum quotas by time zone within region. Landline and cellular telephone numbers are selected using random-digit-dial methods.
View survey methodology, complete question responses and trends.
Learn more about how the Gallup Poll Social Series works.