Story Highlights
- From the 1940s to the 1970s, about two in five U.S. adults smoked
- Smoking rate has fallen most sharply among young adults
- Middle-aged adults now more likely to smoke than youngest adults
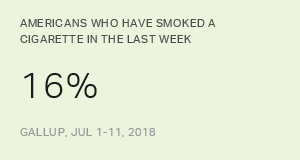
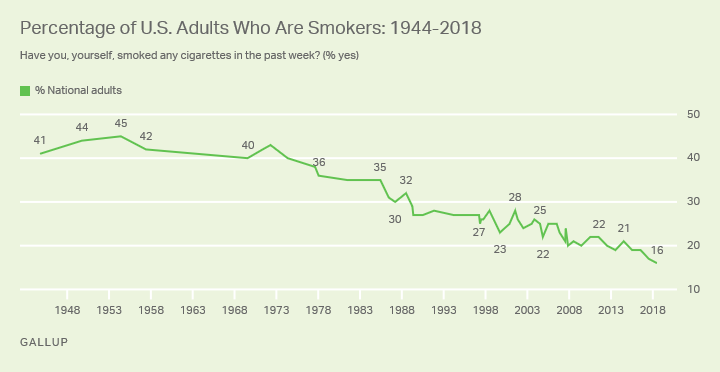
WASHINGTON, D.C -- Sixteen percent of U.S. adults say they smoked a cigarette in the past week, by one percentage point the lowest level on record since Gallup first asked this question in 1944.
These latest data come from a July 1-11 Gallup poll.
In 1944, 41% of U.S. adults said they smoked; this figure held steady for the next several decades, even after the federal government warned the public in the early 1960s that smoking was a health threat.
At the start of the 1970s, four in 10 Americans still reported smoking, but by 1977, the rate had fallen to 36%. Twelve years later, in 1989, the smoking rate fell below the 30% mark for the first time. However, over the next two decades the smoking rate was relatively stable with about a quarter of Americans saying they smoked.
In the late 2000s, smoking levels began to slowly drop again, when many cities and states started passing public smoking bans. In 2013, the percentage of Americans who smoked fell below 20% for the first time, where it has remained for four out of the five years since, including this most recent reading of 16%.
Smoking Rate Among Young Adults Has Fallen by Half Since 2001
Smoking rates among young adults, those aged 18-29, have declined most dramatically since 2001. Over the past three years, 15% of adults aged 18-29 say they smoked a cigarette in the past week, compared with the 34% who said so in the early 2000s. By contrast, smoking rates among Americans aged 30-49 have fallen by eight percentage points over this time period and, among older Americans, have essentially not budged.
| 2001-2005 | 2006-2010 | 2011-2015 | 2016-2018 | ||||||||||||||||||||||||||||||||||||||||||||||||||||||||||||||||||||||||||||||||||||||||||||||||
|---|---|---|---|---|---|---|---|---|---|---|---|---|---|---|---|---|---|---|---|---|---|---|---|---|---|---|---|---|---|---|---|---|---|---|---|---|---|---|---|---|---|---|---|---|---|---|---|---|---|---|---|---|---|---|---|---|---|---|---|---|---|---|---|---|---|---|---|---|---|---|---|---|---|---|---|---|---|---|---|---|---|---|---|---|---|---|---|---|---|---|---|---|---|---|---|---|---|---|---|
| % | % | % | % | ||||||||||||||||||||||||||||||||||||||||||||||||||||||||||||||||||||||||||||||||||||||||||||||||
| U.S. adults | 25 | 22 | 20 | 17 | |||||||||||||||||||||||||||||||||||||||||||||||||||||||||||||||||||||||||||||||||||||||||||||||
| 18-29 | 34 | 28 | 22 | 15 | |||||||||||||||||||||||||||||||||||||||||||||||||||||||||||||||||||||||||||||||||||||||||||||||
| 30-49 | 28 | 25 | 23 | 20 | |||||||||||||||||||||||||||||||||||||||||||||||||||||||||||||||||||||||||||||||||||||||||||||||
| 50-64 | 24 | 22 | 21 | 24 | |||||||||||||||||||||||||||||||||||||||||||||||||||||||||||||||||||||||||||||||||||||||||||||||
| 65+ | 11 | 11 | 11 | 8 | |||||||||||||||||||||||||||||||||||||||||||||||||||||||||||||||||||||||||||||||||||||||||||||||
| Gallup | |||||||||||||||||||||||||||||||||||||||||||||||||||||||||||||||||||||||||||||||||||||||||||||||||||
Notably, the two middle-aged categories are now slightly more likely than their younger counterparts to say they smoke -- reversing the long historical association between smoking and age. For much of the time Gallup has tracked the U.S. smoking rate, the youngest adults were the most likely of any age cohort to light up regularly. But since around 2011, young Americans have been about as or less likely to smoke than the next two oldest age categories.
Bottom Line
While smoking among U.S. adults has fallen considerably since the 1970s -- and hit a low again this year -- the decline has been most striking among 18- to 29-year-olds, at least in the last 20 years. Young adults are now slightly less likely than their middle-aged compatriots to actively smoke, a result that runs contrary to the historical association between smoking and youth.
Many factors may be turning young Americans against cigarette smoking. Though public anti-smoking campaigns were well established by the time this age cohort came along, many of these young adults came of age when public smoking bans became more commonplace throughout the country. These bans may have made smoking seem like a more stigmatizing behavior, while older adults remembered a time when indoor smoking was more common. For instance, a 2015 Gallup poll found that 18- to 29-year-olds are the most likely of any age group to say they have an "unsympathetic" view of smokers.
Survey Methods
Results for this Gallup poll are based on telephone interviews conducted July 1-11, 2018, with a random sample of 1,033 adults, aged 18 and older, living in all 50 U.S. states and the District of Columbia. For results based on the total sample of national adults, the margin of sampling error is ±4 percentage points at the 95% confidence level. All reported margins of sampling error include computed design effects for weighting.
Each sample of national adults includes a minimum quota of 70% cellphone respondents and 30% landline respondents, with additional minimum quotas by time zone within region. Landline and cellular telephone numbers are selected using random-digit-dial methods.
View survey methodology, complete question responses and trends.
Learn more about how the Gallup Poll Social Series works.