Story Highlights
- 46% of women, 61% of men satisfied with how women are treated in society
- Women's satisfaction with treatment of women is record low
- 57% of women satisfied with women's position in U.S., up from 51% in 2018
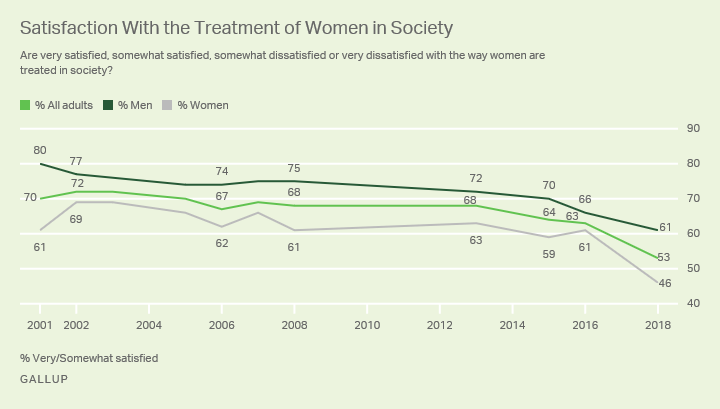
WASHINGTON, D.C. -- As many women across the U.S. prepare to march for women's rights this weekend, Gallup polling finds a record-low 46% of U.S. women are satisfied with the way women are treated in society. This marks a 15-percentage-point decline since the summer of 2016 before the #MeToo movement exploded in the U.S.

While women have become markedly less satisfied with the way women are treated since 2016, men, too, are less satisfied than they were in 2016, but the decline among men is a smaller five percentage points.
These readings, from a Gallup poll conducted Nov. 19- Dec. 22, 2018, are the latest in the trend dating back to June 2001, when 70% of Americans, including 80% of men and 61% of women were "very" or "somewhat" satisfied with the treatment of women.
Although that 19-point gender gap was the highest recorded, men have consistently been more satisfied with women's treatment than women have been. From 2001 to 2016, women's satisfaction levels ranged from 59% to 69% until they dropped precipitously this year. For their part, men's satisfaction with the way women are treated ranged from 70% to 80% from 2001 to 2015. However, it dipped to 66% in 2016 and continued that downward trajectory this year.
Since 2016, more than 400 high profile men in the U.S. have been accused of sexual misconduct as a torrent of accusers came forward to level charges ranging from sexual harassment to sexual assault against them. The most recent data show that 19% of women and 30% of men say they are very satisfied with women's treatment in society and 27% of women and 31% of men are somewhat satisfied.

Demographic Differences in Satisfaction Levels Go Beyond Gender
Race. Even greater differences are evident within each gender's degrees of satisfaction with women's treatment in society. White women (52%) are more than twice as likely as black women (24%) to say they are very or somewhat satisfied. And black men are much less satisfied (35%) than white women and men. White men report the highest satisfaction level -- 67%.
Party. There are sharp partisan differences among men and women as well. Republican men (88%), Republican women (79%) and independent men (62%) are largely satisfied, while the opposite is true of Democratic women (25%), Democratic men (29%) and independent women (43%). The views of Republicans have not changed since 2016, but Democratic men and women are significantly more dissatisfied now. It is unclear whether this is related to the #MeToo movement, President Donald Trump's election, some combination of both factors, or other factors outside of these.
Age. To a lesser extent, there are differences among age groups within each gender. Here too, men aged 50 and older are the most satisfied with the way women are treated (66%) and women younger than 50 are the least satisfied (42%). A slim majority of women aged 50 and older, 51%, are satisfied, as are 57% of men younger than 50.
| Satisfied | Dissatisfied | ||||||||||||||||||||||||||||||||||||||||||||||||||||||||||||||||||||||||||||||||||||||||||||||||||
|---|---|---|---|---|---|---|---|---|---|---|---|---|---|---|---|---|---|---|---|---|---|---|---|---|---|---|---|---|---|---|---|---|---|---|---|---|---|---|---|---|---|---|---|---|---|---|---|---|---|---|---|---|---|---|---|---|---|---|---|---|---|---|---|---|---|---|---|---|---|---|---|---|---|---|---|---|---|---|---|---|---|---|---|---|---|---|---|---|---|---|---|---|---|---|---|---|---|---|---|
| % | % | ||||||||||||||||||||||||||||||||||||||||||||||||||||||||||||||||||||||||||||||||||||||||||||||||||
| White women | 52 | 47 | |||||||||||||||||||||||||||||||||||||||||||||||||||||||||||||||||||||||||||||||||||||||||||||||||
| Black women | 24 | 74 | |||||||||||||||||||||||||||||||||||||||||||||||||||||||||||||||||||||||||||||||||||||||||||||||||
| White men | 67 | 32 | |||||||||||||||||||||||||||||||||||||||||||||||||||||||||||||||||||||||||||||||||||||||||||||||||
| Black men | 35 | 64 | |||||||||||||||||||||||||||||||||||||||||||||||||||||||||||||||||||||||||||||||||||||||||||||||||
| Women aged 18-49 | 42 | 58 | |||||||||||||||||||||||||||||||||||||||||||||||||||||||||||||||||||||||||||||||||||||||||||||||||
| Women aged 50 and older | 51 | 48 | |||||||||||||||||||||||||||||||||||||||||||||||||||||||||||||||||||||||||||||||||||||||||||||||||
| Men aged 18-49 | 57 | 41 | |||||||||||||||||||||||||||||||||||||||||||||||||||||||||||||||||||||||||||||||||||||||||||||||||
| Men aged 50 and older | 66 | 33 | |||||||||||||||||||||||||||||||||||||||||||||||||||||||||||||||||||||||||||||||||||||||||||||||||
| Republican women | 79 | 19 | |||||||||||||||||||||||||||||||||||||||||||||||||||||||||||||||||||||||||||||||||||||||||||||||||
| Independent women | 43 | 57 | |||||||||||||||||||||||||||||||||||||||||||||||||||||||||||||||||||||||||||||||||||||||||||||||||
| Democratic women | 25 | 75 | |||||||||||||||||||||||||||||||||||||||||||||||||||||||||||||||||||||||||||||||||||||||||||||||||
| Republican men | 88 | 9 | |||||||||||||||||||||||||||||||||||||||||||||||||||||||||||||||||||||||||||||||||||||||||||||||||
| Independent men | 62 | 37 | |||||||||||||||||||||||||||||||||||||||||||||||||||||||||||||||||||||||||||||||||||||||||||||||||
| Democratic men | 29 | 70 | |||||||||||||||||||||||||||||||||||||||||||||||||||||||||||||||||||||||||||||||||||||||||||||||||
| GALLUP, Nov. 19-Dec. 22, 2018 | |||||||||||||||||||||||||||||||||||||||||||||||||||||||||||||||||||||||||||||||||||||||||||||||||||
Satisfaction With the Position of Women in the U.S.
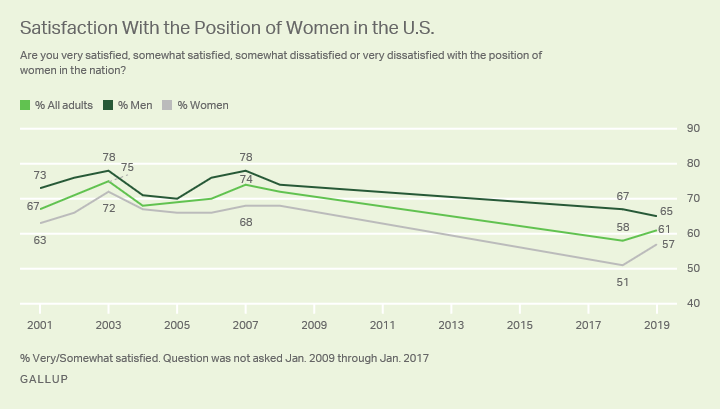
Gallup didn't ask the question about women's treatment in society in 2017, but a question dating back to 2001 about Americans' views of the position of women in the U.S. has now been asked twice since the onslaught of sexual misconduct allegations began. And while women are not pleased with their overall treatment in society, their satisfaction with the position of women in the U.S. has rebounded slightly after hitting record lows in 2018.
The latest findings, from Gallup's annual Mood of the Nation poll conducted Jan. 2-10, 2019, finds 61% of Americans are satisfied with the position women hold in the nation. This includes 57% of women and 65% of men, and it reflects a slight improvement among women (from 51% last year) but essentially no change among men. Although satisfaction among women has recovered a bit, it is still well below the 67% average recorded in 2001 through 2008.

This slight improvement in women's views may be owed to the advances that women have made in the wake of the hundreds of public sexual harassment and assault accusations in the past several years. Many of the high-profile men who were fired because of sexual misconduct were replaced with women. Moreover, for the first time in U.S. history, more than 100 women serve in the House of Representatives, bringing the total in both chambers to 131 women in the 116th Congress.
Despite these recent positive developments, significant segments of some demographic groups of Americans remain dissatisfied with the position of women in the U.S. Less than half of both Democratic women (44%) and men (49%) are satisfied, as are a slim 52% majority of women under the age of 50. Republican men (83%) and women (81%), and men aged 50 and older (70%) are mostly satisfied with the position of women in the nation.
| Satisfied | Dissatisfied | ||||||||||||||||||||||||||||||||||||||||||||||||||||||||||||||||||||||||||||||||||||||||||||||||||
|---|---|---|---|---|---|---|---|---|---|---|---|---|---|---|---|---|---|---|---|---|---|---|---|---|---|---|---|---|---|---|---|---|---|---|---|---|---|---|---|---|---|---|---|---|---|---|---|---|---|---|---|---|---|---|---|---|---|---|---|---|---|---|---|---|---|---|---|---|---|---|---|---|---|---|---|---|---|---|---|---|---|---|---|---|---|---|---|---|---|---|---|---|---|---|---|---|---|---|---|
| % | % | ||||||||||||||||||||||||||||||||||||||||||||||||||||||||||||||||||||||||||||||||||||||||||||||||||
| Women aged 18-49 | 52 | 45 | |||||||||||||||||||||||||||||||||||||||||||||||||||||||||||||||||||||||||||||||||||||||||||||||||
| Women aged 50 and older | 61 | 36 | |||||||||||||||||||||||||||||||||||||||||||||||||||||||||||||||||||||||||||||||||||||||||||||||||
| Men aged 18-49 | 61 | 34 | |||||||||||||||||||||||||||||||||||||||||||||||||||||||||||||||||||||||||||||||||||||||||||||||||
| Men aged 50+ | 70 | 29 | |||||||||||||||||||||||||||||||||||||||||||||||||||||||||||||||||||||||||||||||||||||||||||||||||
| Republican women | 81 | 17 | |||||||||||||||||||||||||||||||||||||||||||||||||||||||||||||||||||||||||||||||||||||||||||||||||
| Independent women | 55 | 44 | |||||||||||||||||||||||||||||||||||||||||||||||||||||||||||||||||||||||||||||||||||||||||||||||||
| Democratic women | 44 | 54 | |||||||||||||||||||||||||||||||||||||||||||||||||||||||||||||||||||||||||||||||||||||||||||||||||
| Republican men | 83 | 17 | |||||||||||||||||||||||||||||||||||||||||||||||||||||||||||||||||||||||||||||||||||||||||||||||||
| Independent men | 65 | 30 | |||||||||||||||||||||||||||||||||||||||||||||||||||||||||||||||||||||||||||||||||||||||||||||||||
| Democratic men | 49 | 47 | |||||||||||||||||||||||||||||||||||||||||||||||||||||||||||||||||||||||||||||||||||||||||||||||||
| GALLUP, Jan. 2-10, 2019 | |||||||||||||||||||||||||||||||||||||||||||||||||||||||||||||||||||||||||||||||||||||||||||||||||||
There is less difference in the degrees of satisfaction with women's position in the U.S. among men and women than there is in the degrees of satisfaction with their treatment in society. Men are somewhat more likely than women to say they are very satisfied with the position of women, but pluralities of both men and women are somewhat satisfied.

Bottom Line
In the wake of the #MeToo movement, a record-low 46% of women in the U.S. are satisfied with the treatment of women in society. Still, the third annual March for Women this weekend comes on the heels of some recent advances for women, namely a historic wave of women elected to Congress in 2018. Although these advances appear to have restored some satisfaction with women's position in the nation, they have yet to revert to their previous higher levels. As a number of women begin to explore the possibility of a presidential run in 2020, they might be able to use this wave of dissatisfaction to their advantage.


