Story Highlights
- 56% of women prefer to work rather than to be homemaker
- 75% of men would rather work outside the home
- 50% of women with children under age 18 prefer to stay home; 45%, to work
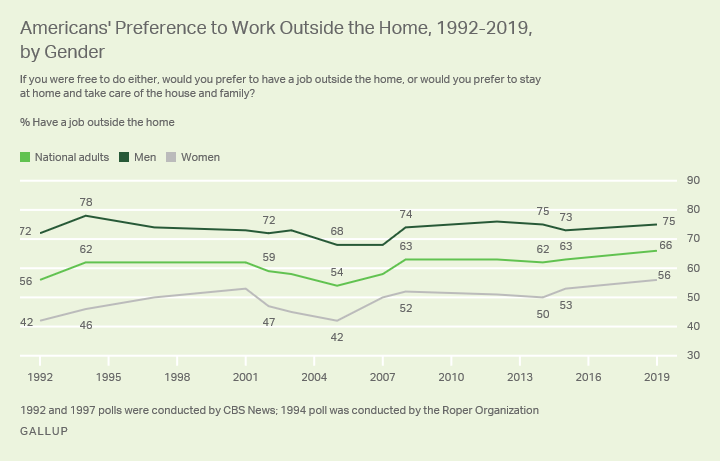
WASHINGTON, D.C. -- Given the choice between working or staying home to take care of the house and family, a record-high 66% of U.S. adults would prefer to work. While women's preference to work outside the home (56%) continues to lag behind men's (75%), it is at its highest point in roughly three decades.

The latest reading, from an Aug. 1-14 poll, marks the 10th time Gallup has asked Americans for their preferences on this measure since 2001. The question was periodically included in other organizations' polling between 1974 and 1999, although some of those readings were only among women. From 1992 until now, the question has been asked more regularly, with a consistent majority of Americans preferring to work outside the home -- ranging between 54% and the current 66% reading.
The most notable demographic difference on this question continues to be between men and women. Men's preference for working outside of the home has varied by 10 percentage points since 1992, from 68% to 78%. Women's views have shown slightly more variation than men's over the same period, shifting between 42% and the current 56% high who have said they prefer to work, rather than serving in a homemaker role, if they were free to do either. Historically, the low point in women's preference for working outside the home is 36% in a 1974 Roper Organization poll.
While at least half of women overall have preferred working over staying home since 2007, as recently as 2003 and 2005, slim majorities of women favored the more traditional domestic role of homemaking.
Demographic Differences in Women's Preferences
Not only do men and women differ in their preferences for working or staying home, but there are significant differences in women's views, depending on their parental, work and educational status. The same is not true of men, who, regardless of their demographics, broadly prefer to work outside the home.
By 50% to 34%, mothers of children under 18 years of age are more likely than those with no children under 18 to prefer to stay at home and take care of the house and family. Many of these women are currently fulfilling this role in their households, which may account for their preferences. Women who have graduated from college and those who are currently employed are much more likely to prefer to work at a job outside the home.
| Prefer to work outside home | Prefer homemaker role | |||||||||||||||||||||||||||||||||||||||||||||||||||||||||||||||||||||||||||||||||||||||||||||||||||
|---|---|---|---|---|---|---|---|---|---|---|---|---|---|---|---|---|---|---|---|---|---|---|---|---|---|---|---|---|---|---|---|---|---|---|---|---|---|---|---|---|---|---|---|---|---|---|---|---|---|---|---|---|---|---|---|---|---|---|---|---|---|---|---|---|---|---|---|---|---|---|---|---|---|---|---|---|---|---|---|---|---|---|---|---|---|---|---|---|---|---|---|---|---|---|---|---|---|---|---|---|
| % | % | |||||||||||||||||||||||||||||||||||||||||||||||||||||||||||||||||||||||||||||||||||||||||||||||||||
| Gender | ||||||||||||||||||||||||||||||||||||||||||||||||||||||||||||||||||||||||||||||||||||||||||||||||||||
| Women | 56 | 39 | ||||||||||||||||||||||||||||||||||||||||||||||||||||||||||||||||||||||||||||||||||||||||||||||||||
| Men | 75 | 23 | ||||||||||||||||||||||||||||||||||||||||||||||||||||||||||||||||||||||||||||||||||||||||||||||||||
| Gender and parental status | ||||||||||||||||||||||||||||||||||||||||||||||||||||||||||||||||||||||||||||||||||||||||||||||||||||
| Women with children under 18 | 45 | 50 | ||||||||||||||||||||||||||||||||||||||||||||||||||||||||||||||||||||||||||||||||||||||||||||||||||
| Women without children under 18 | 62 | 34 | ||||||||||||||||||||||||||||||||||||||||||||||||||||||||||||||||||||||||||||||||||||||||||||||||||
| Men with children under 18 | 71 | 29 | ||||||||||||||||||||||||||||||||||||||||||||||||||||||||||||||||||||||||||||||||||||||||||||||||||
| Men without children under 18 | 78 | 21 | ||||||||||||||||||||||||||||||||||||||||||||||||||||||||||||||||||||||||||||||||||||||||||||||||||
| Gender and employment status | ||||||||||||||||||||||||||||||||||||||||||||||||||||||||||||||||||||||||||||||||||||||||||||||||||||
| Employed women | 69 | 27 | ||||||||||||||||||||||||||||||||||||||||||||||||||||||||||||||||||||||||||||||||||||||||||||||||||
| Not employed women | 45 | 50 | ||||||||||||||||||||||||||||||||||||||||||||||||||||||||||||||||||||||||||||||||||||||||||||||||||
| Employed men | 80 | 19 | ||||||||||||||||||||||||||||||||||||||||||||||||||||||||||||||||||||||||||||||||||||||||||||||||||
| Not employed men | 67 | 30 | ||||||||||||||||||||||||||||||||||||||||||||||||||||||||||||||||||||||||||||||||||||||||||||||||||
| Gender and education | ||||||||||||||||||||||||||||||||||||||||||||||||||||||||||||||||||||||||||||||||||||||||||||||||||||
| Women with college degree | 64 | 30 | ||||||||||||||||||||||||||||||||||||||||||||||||||||||||||||||||||||||||||||||||||||||||||||||||||
| Women without college degree | 52 | 44 | ||||||||||||||||||||||||||||||||||||||||||||||||||||||||||||||||||||||||||||||||||||||||||||||||||
| Men with college degree | 82 | 18 | ||||||||||||||||||||||||||||||||||||||||||||||||||||||||||||||||||||||||||||||||||||||||||||||||||
| Men without college degree | 73 | 26 | ||||||||||||||||||||||||||||||||||||||||||||||||||||||||||||||||||||||||||||||||||||||||||||||||||
| GALLUP, Aug. 1-14, 2019 | ||||||||||||||||||||||||||||||||||||||||||||||||||||||||||||||||||||||||||||||||||||||||||||||||||||
Looking more closely at the data, there are notable distinctions between those who do and do not have minor children. Two-thirds of mothers who are currently not employed and have minor children prefer to stay home, but 57% of mothers who are employed and have minor children prefer to work outside the home. At the same time, majorities of women who do not have children younger than 18 -- whether they are currently employed or not -- would opt to work rather than stay home.
| Prefer to work outside home | Prefer homemaker role | |||||||||||||||||||||||||||||||||||||||||||||||||||||||||||||||||||||||||||||||||||||||||||||||||||
|---|---|---|---|---|---|---|---|---|---|---|---|---|---|---|---|---|---|---|---|---|---|---|---|---|---|---|---|---|---|---|---|---|---|---|---|---|---|---|---|---|---|---|---|---|---|---|---|---|---|---|---|---|---|---|---|---|---|---|---|---|---|---|---|---|---|---|---|---|---|---|---|---|---|---|---|---|---|---|---|---|---|---|---|---|---|---|---|---|---|---|---|---|---|---|---|---|---|---|---|---|
| % | % | |||||||||||||||||||||||||||||||||||||||||||||||||||||||||||||||||||||||||||||||||||||||||||||||||||
| Parents of a child under 18 | ||||||||||||||||||||||||||||||||||||||||||||||||||||||||||||||||||||||||||||||||||||||||||||||||||||
| Employed women | 57 | 36 | ||||||||||||||||||||||||||||||||||||||||||||||||||||||||||||||||||||||||||||||||||||||||||||||||||
| Not employed women | 30 | 67 | ||||||||||||||||||||||||||||||||||||||||||||||||||||||||||||||||||||||||||||||||||||||||||||||||||
| Employed men | 73 | 26 | ||||||||||||||||||||||||||||||||||||||||||||||||||||||||||||||||||||||||||||||||||||||||||||||||||
| Not employed men | 58 | 42 | ||||||||||||||||||||||||||||||||||||||||||||||||||||||||||||||||||||||||||||||||||||||||||||||||||
| Not parents of a child under 18 | ||||||||||||||||||||||||||||||||||||||||||||||||||||||||||||||||||||||||||||||||||||||||||||||||||||
| Employed women | 75 | 22 | ||||||||||||||||||||||||||||||||||||||||||||||||||||||||||||||||||||||||||||||||||||||||||||||||||
| Not employed women | 51 | 43 | ||||||||||||||||||||||||||||||||||||||||||||||||||||||||||||||||||||||||||||||||||||||||||||||||||
| Employed men | 85 | 14 | ||||||||||||||||||||||||||||||||||||||||||||||||||||||||||||||||||||||||||||||||||||||||||||||||||
| Not employed men | 69 | 28 | ||||||||||||||||||||||||||||||||||||||||||||||||||||||||||||||||||||||||||||||||||||||||||||||||||
| GALLUP, Aug. 1-14, 2019 | ||||||||||||||||||||||||||||||||||||||||||||||||||||||||||||||||||||||||||||||||||||||||||||||||||||
Again, the differences between men and women are significant, particularly among those who have children under 18.
Bottom Line
Women are more likely now than they have been in the past three decades to say they would prefer to work outside the home than to stay at home and take care of their house and family. While women made up 47% of the workforce in 2018, and cultural advances over the past 50 years have led to a change in social norms, women remain far less likely than men to say they would prefer to work. In particular, mothers of children under age 18 are more likely than those without younger children to prefer to stay home.
View complete question responses and trends.
Learn more about how the Gallup Poll Social Series works.


