Story Highlights
- Approval among suburbanites has fallen below majority level this year
- Republicans, conservatives, rural residents, White men mostly approve
- Democrats, liberals, non-White and LGBTQ adults largely disapprove
WASHINGTON, D.C. -- Donald Trump's approval rating has dropped significantly this year among some key demographic groups of Americans who helped propel him to victory in 2016. This includes suburbanites (both men and women) and residents of the Southwest, Great Lakes and Rocky Mountain regions, all of whom now register approval of the president below the majority level.
Many groups that already largely disapproved of the president became even more likely to do so as this year wore on. Americans in these groups did not support Trump in 2016, including non-White adults, younger adults, and lesbian, gay, bisexual and transgender (LGBTQ) adults.
The groups in the following chart each show declines of at least eight points -- significantly above the five-point drop in the president's job approval rating among all Americans.
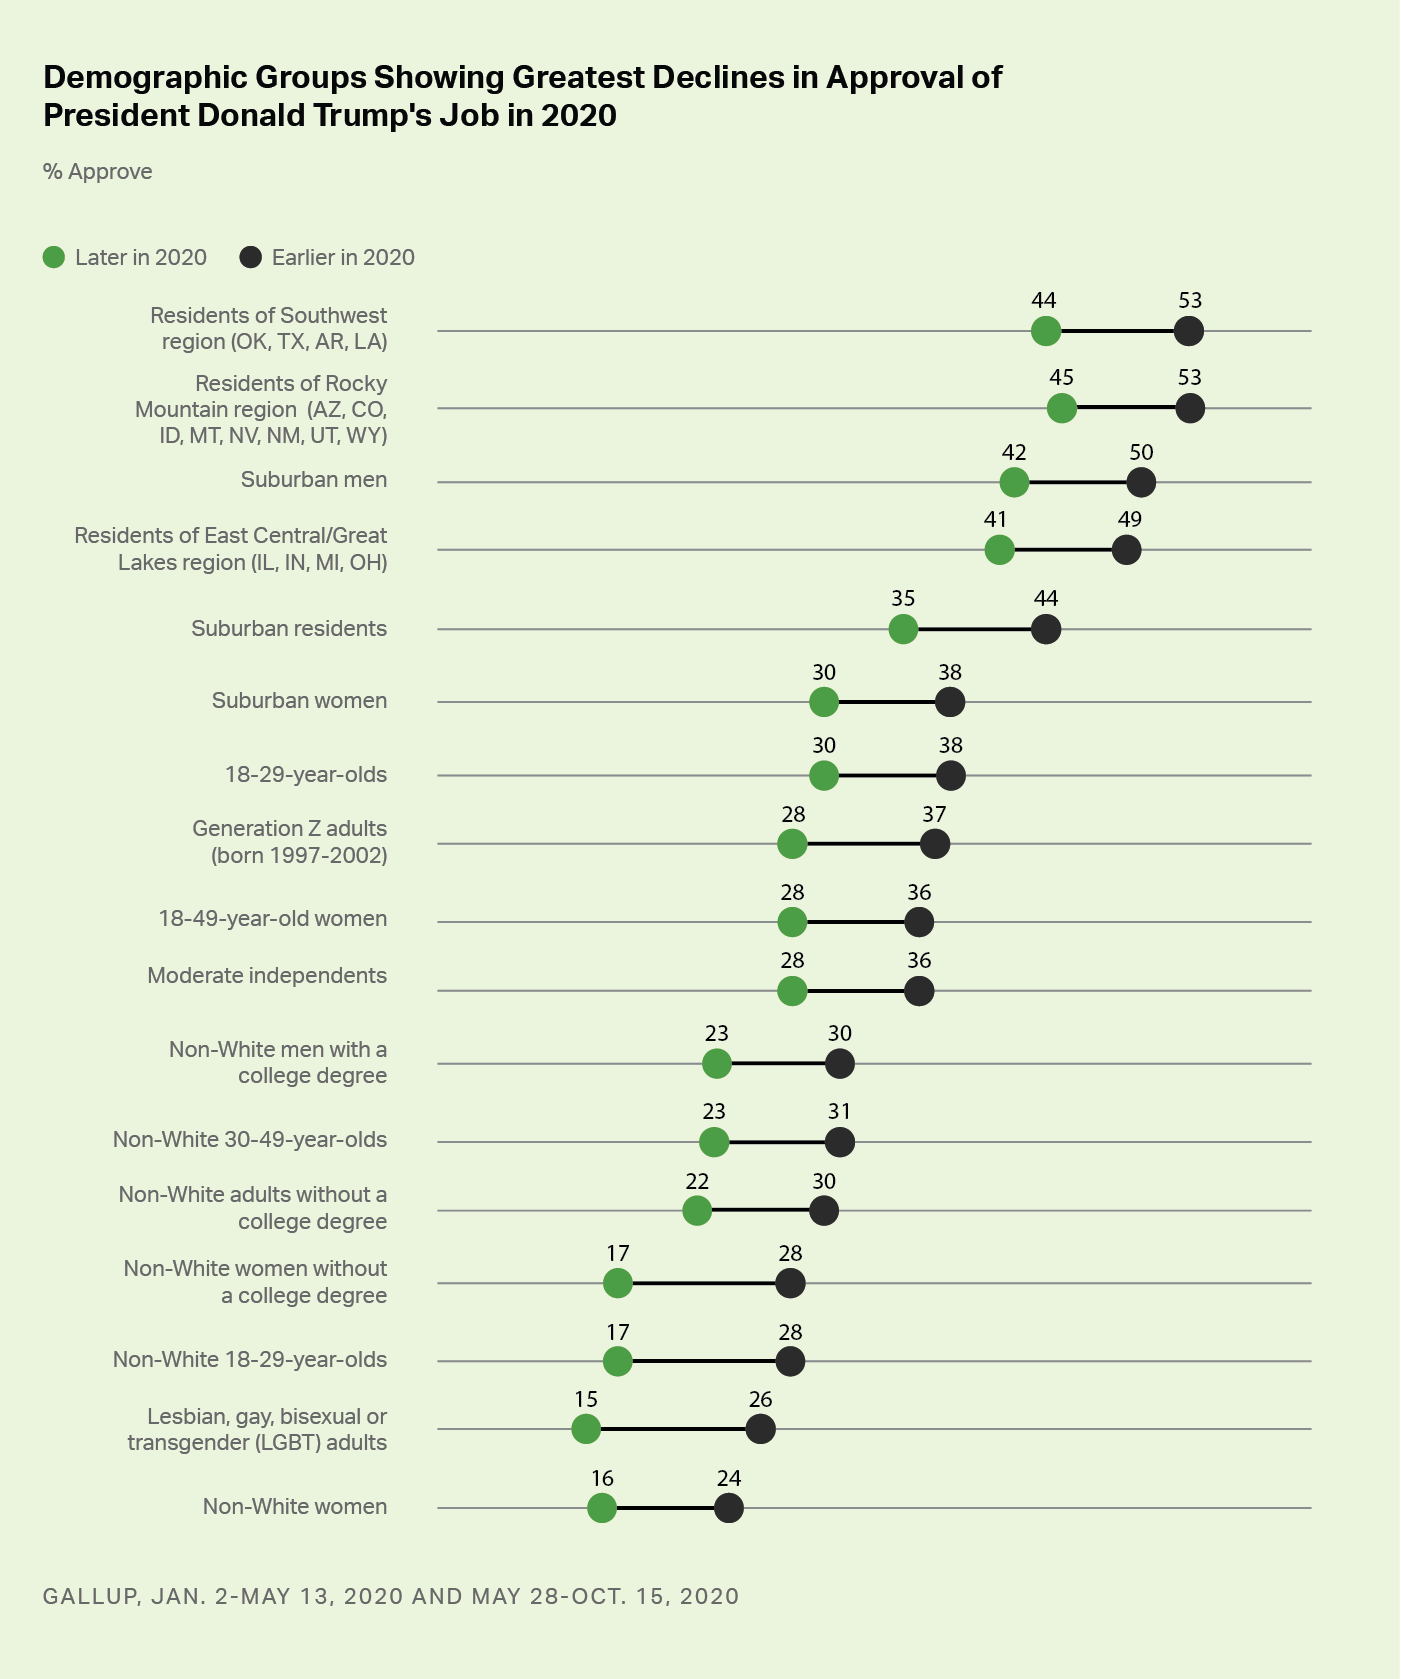
Range plot graph showing the decline in approval ratings of President Donald Trump among 17 demographic groups of Americans in two time periods in 2020 - January 2 through May 13 and May 28 through October 15.
This analysis is based on aggregated Gallup data from 2020 divided into two time periods -- January 2-May 13 and May 28- October 15, during which a number of national events affected the public's approval rating of the president. During the earlier period, Gallup interviewed 9,194 U.S. adults in nine separate polls; in the latter period, 7,166 adults were interviewed in seven polls.
The first date range encompassed Trump's acquittal in the Senate impeachment trial and the beginning of the coronavirus pandemic in the U.S. During this period, the president averaged 47% job approval, including five separate 49% ratings, which are the highest of his presidency.
The second period -- which began shortly after George Floyd died in police custody -- showed a clear drop in Trump's approval rating, with an average 42% of U.S. adults saying they approved of Trump. This time period included nationwide protests about racial injustice as well as a resurgence of the coronavirus in Sun Belt states, Trump's nomination of Amy Coney Barrett to the Supreme Court, the contentious first presidential debate and Trump contracting the coronavirus.
None of the subgroups analyzed in this report showed meaningful increases in job approval. However, a small number of groups -- including Republicans overall and Republicans who say they have conservative political views -- did not show a meaningful decline in approval this year.
View a full list of all subgroups analyzed for this report (PDF download).
Demographic Groups With Highest and Lowest Presidential Approval Ratings
Trump maintains majority-level approval ratings among his base, including Republicans, conservatives, rural residents, White men and White adults without college degrees.
Conservative Republicans -- among whom 96% approve of Trump -- are the group most supportive of the president. The vast majority of moderate and liberal Republicans -- 77% -- also approve of the job the president is doing. Beyond the political and ideological subgroups, Trump's approval rating is highest among White men without a college degree (66%).
| Approve | |||||||||||||||||||||||||||||||||||||||||||||||||||||||||||||||||||||||||||||||||||||||||||||||||||
|---|---|---|---|---|---|---|---|---|---|---|---|---|---|---|---|---|---|---|---|---|---|---|---|---|---|---|---|---|---|---|---|---|---|---|---|---|---|---|---|---|---|---|---|---|---|---|---|---|---|---|---|---|---|---|---|---|---|---|---|---|---|---|---|---|---|---|---|---|---|---|---|---|---|---|---|---|---|---|---|---|---|---|---|---|---|---|---|---|---|---|---|---|---|---|---|---|---|---|---|
| % | |||||||||||||||||||||||||||||||||||||||||||||||||||||||||||||||||||||||||||||||||||||||||||||||||||
| Conservative Republicans | 96 | ||||||||||||||||||||||||||||||||||||||||||||||||||||||||||||||||||||||||||||||||||||||||||||||||||
| Republicans | 91 | ||||||||||||||||||||||||||||||||||||||||||||||||||||||||||||||||||||||||||||||||||||||||||||||||||
| Moderate or liberal Republicans | 77 | ||||||||||||||||||||||||||||||||||||||||||||||||||||||||||||||||||||||||||||||||||||||||||||||||||
| Conservatives | 78 | ||||||||||||||||||||||||||||||||||||||||||||||||||||||||||||||||||||||||||||||||||||||||||||||||||
| White men without a college degree | 66 | ||||||||||||||||||||||||||||||||||||||||||||||||||||||||||||||||||||||||||||||||||||||||||||||||||
| Conservative independents | 65 | ||||||||||||||||||||||||||||||||||||||||||||||||||||||||||||||||||||||||||||||||||||||||||||||||||
| Residents of rural areas | 61 | ||||||||||||||||||||||||||||||||||||||||||||||||||||||||||||||||||||||||||||||||||||||||||||||||||
| White adults without a college degree | 61 | ||||||||||||||||||||||||||||||||||||||||||||||||||||||||||||||||||||||||||||||||||||||||||||||||||
| Men in rural areas | 60 | ||||||||||||||||||||||||||||||||||||||||||||||||||||||||||||||||||||||||||||||||||||||||||||||||||
| White men | 58 | ||||||||||||||||||||||||||||||||||||||||||||||||||||||||||||||||||||||||||||||||||||||||||||||||||
| GALLUP, May 28-Oct 15, 2020 | |||||||||||||||||||||||||||||||||||||||||||||||||||||||||||||||||||||||||||||||||||||||||||||||||||
At the same time, the demographic groups registering the lowest approval ratings of Trump include Democrats, liberals, Black adults, non-White older adults, and LGBTQ Americans.
One percent of liberal Democrats approve of the job Trump is doing, as do 5% of moderate Democrats and 17% of conservative Democrats. Though Trump frequently argues his policies have greatly benefitted the Black community, his 10% approval rating among Black adults is the lowest among the non-political subgroups.
| Approve | |||||||||||||||||||||||||||||||||||||||||||||||||||||||||||||||||||||||||||||||||||||||||||||||||||
|---|---|---|---|---|---|---|---|---|---|---|---|---|---|---|---|---|---|---|---|---|---|---|---|---|---|---|---|---|---|---|---|---|---|---|---|---|---|---|---|---|---|---|---|---|---|---|---|---|---|---|---|---|---|---|---|---|---|---|---|---|---|---|---|---|---|---|---|---|---|---|---|---|---|---|---|---|---|---|---|---|---|---|---|---|---|---|---|---|---|---|---|---|---|---|---|---|---|---|---|
| % | |||||||||||||||||||||||||||||||||||||||||||||||||||||||||||||||||||||||||||||||||||||||||||||||||||
| Liberal Democrats | 1 | ||||||||||||||||||||||||||||||||||||||||||||||||||||||||||||||||||||||||||||||||||||||||||||||||||
| Democrats | 4 | ||||||||||||||||||||||||||||||||||||||||||||||||||||||||||||||||||||||||||||||||||||||||||||||||||
| Moderate Democrats | 5 | ||||||||||||||||||||||||||||||||||||||||||||||||||||||||||||||||||||||||||||||||||||||||||||||||||
| Black adults | 10 | ||||||||||||||||||||||||||||||||||||||||||||||||||||||||||||||||||||||||||||||||||||||||||||||||||
| Liberals | 11 | ||||||||||||||||||||||||||||||||||||||||||||||||||||||||||||||||||||||||||||||||||||||||||||||||||
| Non-White women with a college degree | 12 | ||||||||||||||||||||||||||||||||||||||||||||||||||||||||||||||||||||||||||||||||||||||||||||||||||
| Non-White adults 65 years old and over | 14 | ||||||||||||||||||||||||||||||||||||||||||||||||||||||||||||||||||||||||||||||||||||||||||||||||||
| Lesbian, gay, bisexual or transgender (LGBT) adults | 15 | ||||||||||||||||||||||||||||||||||||||||||||||||||||||||||||||||||||||||||||||||||||||||||||||||||
| Non-White women | 16 | ||||||||||||||||||||||||||||||||||||||||||||||||||||||||||||||||||||||||||||||||||||||||||||||||||
| Non-White adults with a college degree | 17 | ||||||||||||||||||||||||||||||||||||||||||||||||||||||||||||||||||||||||||||||||||||||||||||||||||
| GALLUP, May 28-Oct 15, 2020 | |||||||||||||||||||||||||||||||||||||||||||||||||||||||||||||||||||||||||||||||||||||||||||||||||||
Bottom Line
Trump began 2020 with the highest approval ratings of his presidency, but as the coronavirus pandemic wore on and racial strife intensified nationwide, Americans' approval of the president declined among nearly all subgroups except for his most loyal supporters. He is now in the homestretch of the campaign with a relatively low overall job approval rating, a measure which has historically proven to be closely tied to chances of winning a second term.
Learn more about how the Gallup Poll Social Series works.