Story Highlights
- 65% of Americans willing to be vaccinated for the coronavirus
- Democrats' willingness fully restored after wavering in September
- Majorities in all major demographic groups except Republicans stand ready
WASHINGTON, D.C. -- Nearly two-thirds of Americans in December said they would be willing to take an FDA-approved vaccine right now if available at no cost. The 65% saying this was essentially unchanged from 63% in November, even after the FDA approved the use of two vaccines and those were starting to be administered to healthcare workers and nursing home residents nationwide.

Line graph. Monthly trend since July in the percentage of Americans who would agree to be vaccinated for the coronavirus/COVID-19 if an FDA-approved vaccine were available right now at no cost. The percentage willing is back up to 65% in late December, similar to where it was in July and August after falling to 50% in September.
The latest results are based on a survey of more than 3,000 U.S. adults conducted Dec. 15, 2020, to Jan. 3, 2021, using the probability-based online Gallup Panel survey.
Democrats' Willingness Expands While Republicans' Slips
The stability in Americans' vaccine readiness in December masks a widening partisan divide on the matter. The percentage of Democrats willing to receive the vaccine has risen eight percentage points in the most recent poll to 83%, while the percentage of Republicans slipped five points to 45%.
Partisan attitudes are now nearly identical to what they were in Gallup's first reading on this question in July. By late August, Republicans' willingness had fallen to 37%, but it rebounded in September to 49% after President Donald Trump began touting the possibility that a vaccine would be ready by Election Day. The same announcement may have been at the root of Democrats' decreased willingness (to 53%) in September, given fears the approval process would be unduly rushed. Since then, Democrats' comfort level has slowly recovered, while Republicans' remained near 50% until December.
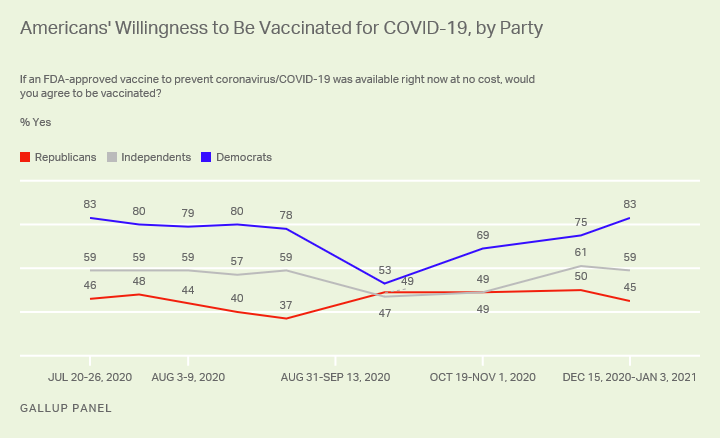
Line graph. Trend since July 2020 in willingness to get COVID-19 vaccine, by party ID. As of December, figures are 83% among Democrats, 59% among independents and 45% among Republicans, nearly identical to attitudes in July. Democrats have consistently been more willing than Republicans to be vaccinated, except in September, when the figure among Democrats fell to 53%.
Racial Gap Narrows, Education Gap Reopens, Age Gap Stable
Unlike the partisan differences, majorities of all other key demographic groups are willing to be vaccinated.
-
Although non-White Americans lean more Democratic than Republican in their political orientation, non-White adults are less likely than White adults to want to be vaccinated. The persistent racial gap seen in recent months -- with non-White adults less likely than White adults to have this attitude -- shrank to five points in December from double digits.
-
Willingness to be vaccinated is also a function of education. Gallup has consistently found four-year college graduates more likely than U.S. adults without a college degree to say they would get the COVID-19 vaccine, but after narrowing in November to seven points, that gap widened to 17 points in December.
-
Meanwhile, a positive sign for the campaign to vaccinate Americans' elderly population is that seniors remain the most willing of all age groups, similar to November. Seventy-four percent of adults 65 and older are willing to be vaccinated (tied for the highest among this group and the most of any age group). Attitudes about vaccination were also steady among young and middle-aged adults in the past month.
| Jul 20-26, 2020 |
Sep 14-27, 2020 |
Nov 16-29, 2020 |
Dec 15, 2020-Jan 3, 2021 |
|||||||||||||||||||||||||||||||||||||||||||||||||||||||||||||||||||||||||||||||||||||||||||||||||
|---|---|---|---|---|---|---|---|---|---|---|---|---|---|---|---|---|---|---|---|---|---|---|---|---|---|---|---|---|---|---|---|---|---|---|---|---|---|---|---|---|---|---|---|---|---|---|---|---|---|---|---|---|---|---|---|---|---|---|---|---|---|---|---|---|---|---|---|---|---|---|---|---|---|---|---|---|---|---|---|---|---|---|---|---|---|---|---|---|---|---|---|---|---|---|---|---|---|---|---|---|
| % | % | % | % | |||||||||||||||||||||||||||||||||||||||||||||||||||||||||||||||||||||||||||||||||||||||||||||||||
| Total U.S. adults | 66 | 50 | 63 | 65 | ||||||||||||||||||||||||||||||||||||||||||||||||||||||||||||||||||||||||||||||||||||||||||||||||
| Gender | ||||||||||||||||||||||||||||||||||||||||||||||||||||||||||||||||||||||||||||||||||||||||||||||||||||
| Men | 65 | 56 | 66 | 67 | ||||||||||||||||||||||||||||||||||||||||||||||||||||||||||||||||||||||||||||||||||||||||||||||||
| Women | 67 | 44 | 60 | 64 | ||||||||||||||||||||||||||||||||||||||||||||||||||||||||||||||||||||||||||||||||||||||||||||||||
| Age | ||||||||||||||||||||||||||||||||||||||||||||||||||||||||||||||||||||||||||||||||||||||||||||||||||||
| 18-44 | 68 | 60 | 68 | 66 | ||||||||||||||||||||||||||||||||||||||||||||||||||||||||||||||||||||||||||||||||||||||||||||||||
| 45-64 | 62 | 36 | 52 | 58 | ||||||||||||||||||||||||||||||||||||||||||||||||||||||||||||||||||||||||||||||||||||||||||||||||
| 65+ | 68 | 54 | 74 | 74 | ||||||||||||||||||||||||||||||||||||||||||||||||||||||||||||||||||||||||||||||||||||||||||||||||
| Education | ||||||||||||||||||||||||||||||||||||||||||||||||||||||||||||||||||||||||||||||||||||||||||||||||||||
| No college degree | 62 | 45 | 61 | 60 | ||||||||||||||||||||||||||||||||||||||||||||||||||||||||||||||||||||||||||||||||||||||||||||||||
| College degree | 75 | 60 | 68 | 77 | ||||||||||||||||||||||||||||||||||||||||||||||||||||||||||||||||||||||||||||||||||||||||||||||||
| Race/Ethnicity | ||||||||||||||||||||||||||||||||||||||||||||||||||||||||||||||||||||||||||||||||||||||||||||||||||||
| White adults | 64 | 54 | 67 | 67 | ||||||||||||||||||||||||||||||||||||||||||||||||||||||||||||||||||||||||||||||||||||||||||||||||
| Non-White adults | 72 | 40 | 53 | 62 | ||||||||||||||||||||||||||||||||||||||||||||||||||||||||||||||||||||||||||||||||||||||||||||||||
| Gallup Panel | ||||||||||||||||||||||||||||||||||||||||||||||||||||||||||||||||||||||||||||||||||||||||||||||||||||
Bottom Line
The American public's willingness to be vaccinated against the coronavirus leveled off in the mid-60% range toward the end of 2020 after slipping to a worrisome degree in September. The current 65% who would be vaccinated today if they could is about tied with the most support Gallup has found historically for any vaccine going back to polio in 1954. Any further increase seen in the months ahead will make the COVID-19 vaccine the most popular in history from a public relations standpoint. However, with Democrats approaching universal acceptance of the vaccine, any future expansion will mostly need to come from independents and Republicans.
Learn more about how the Gallup Panel works.