Story Highlights
- 51% say coronavirus situation is getting better, up from 20% in September
- 36% are worried about contracting COVID-19; was 40% in September
- 51% think pandemic disruption will continue throughout 2022; 28%, longer
WASHINGTON, D.C. -- Americans' outlook for the coronavirus pandemic in the U.S. has improved, as the summer surge brought on by the delta variant has waned in most parts of the country. The percentage of Americans who now say the U.S. COVID-19 situation is improving has more than doubled between September and October, to 51%.
Over the same period, worry about contracting the virus has edged down four percentage points, to 36%, and concern about the availability of hospital supplies, treatment and services has tumbled 10 points, to 33%. Although the public is more optimistic about the current state of the pandemic, a majority thinks the disruption to life will continue throughout 2022 or longer than that.
These findings are from an Oct. 18-24 update of Gallup's COVID-19 survey, which interviewed more than 4,000 members of its probability-based panel by web. Interviewing was conducted at a time when COVID-19 cases, hospitalizations and deaths were down sharply from the most recent peak.
Marked Improvement in Americans' Assessment of COVID-19 Situation
The slim 51% majority of Americans who think the coronavirus situation is getting a lot (12%) or a little (39%) better is up 31 points since September. At the same time, 31% of U.S. adults say the situation is staying the same, and the percentage saying the pandemic is getting worse has plunged 36 points to 18%.
The latest reading marks the first time since June that a majority of U.S. adults think the pandemic is improving; however, it is well below the 60% to 89% range of February through June, before the highly contagious delta variant caused a rise in U.S. COVID-19 cases. Gallup has established the fact that views of the pandemic are directly related to infection rates.
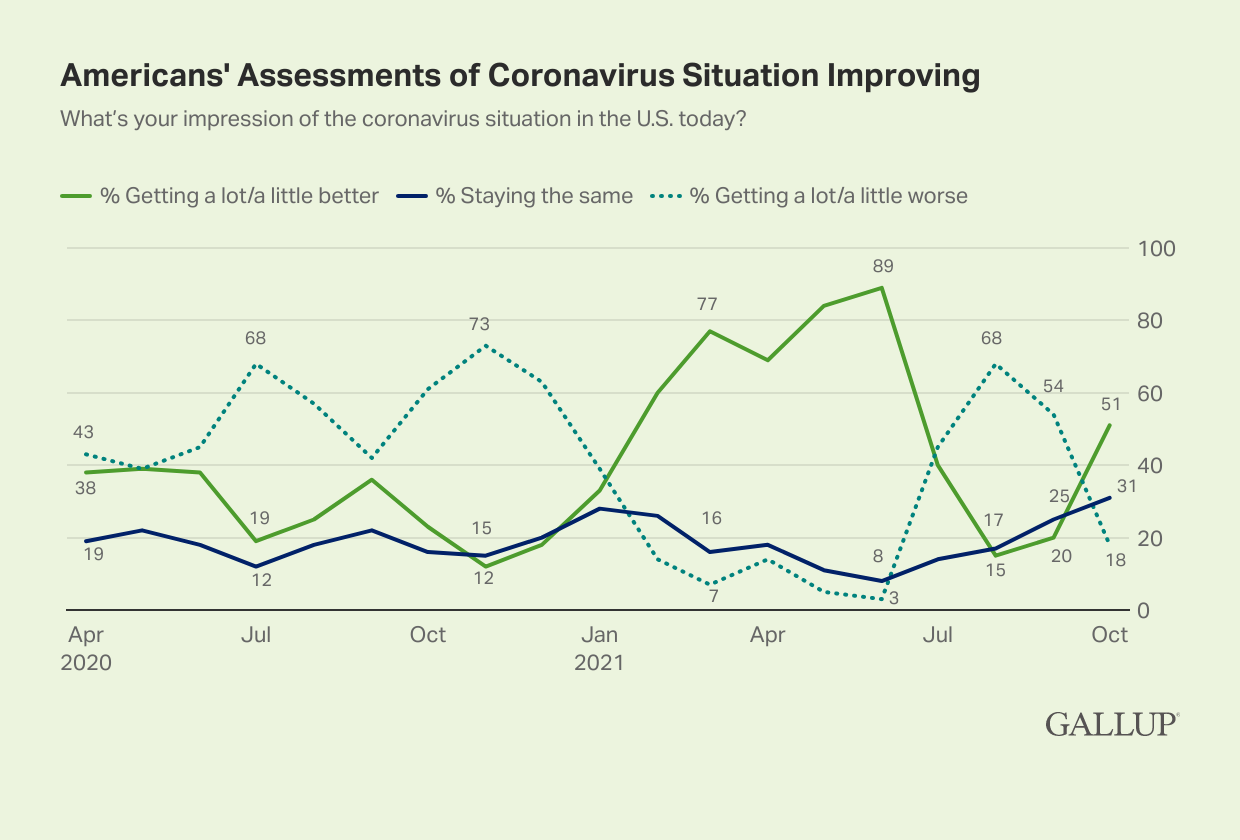
Line graph. Percentages of Americans who think the coronavirus situation in the U.S. is getting a lot or a little better, staying the same, or getting a lot or a little worse, from April 2020 to October 2021. Currently, 51% of U.S. adults say it is getting better, up from 20% in September. And 31% say it is staying the same and 18% say it is getting worse.
Concern About Getting COVID-19 and Hospital Capacity Edges Down
While Americans' worry about contracting COVID-19 has consistently been below 50% since February, it rose 12 points between June and July and another 10 points by August. The current 36% reading marks a slight dip from 40% in September.
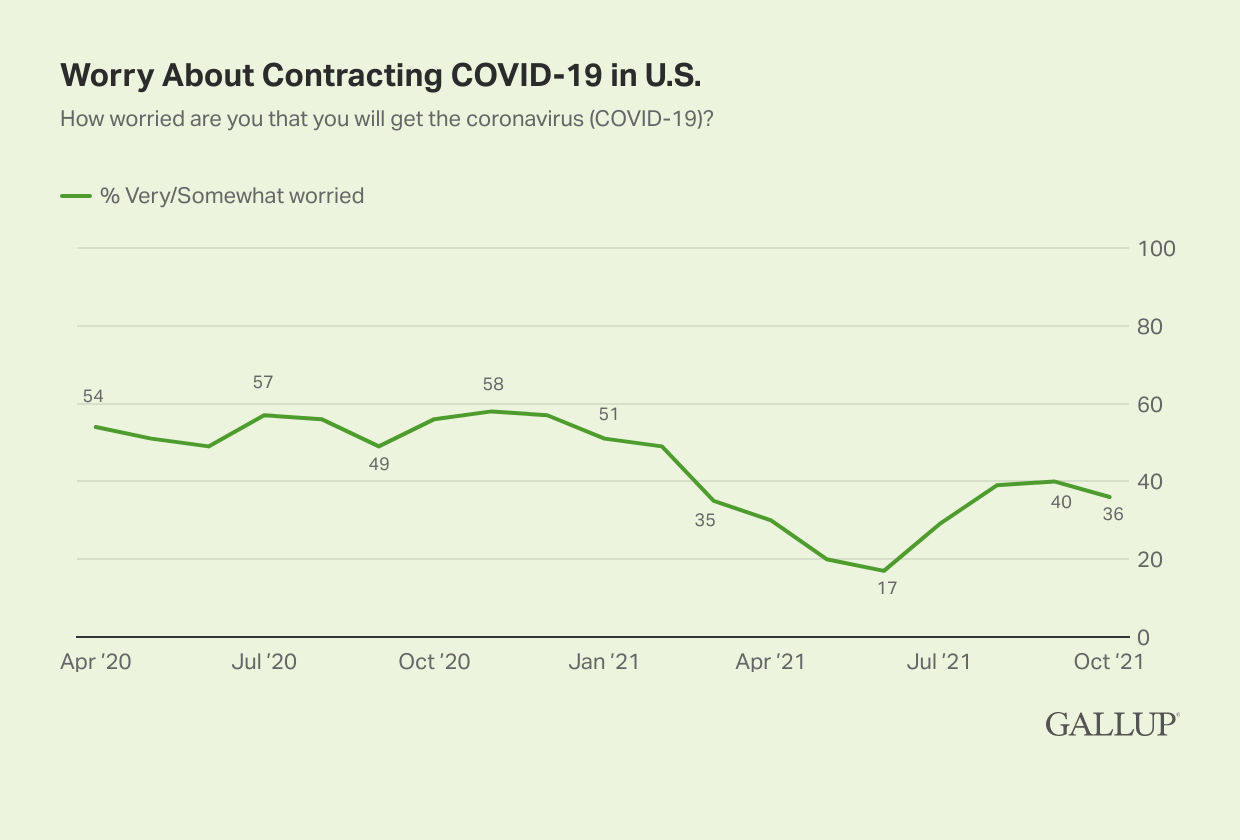
Line graph. Percentage of Americans who are very or somewhat worried that they will get the coronavirus since April 2020. Currently, 36% are worried, which is down slightly from 40% last month. The highest on record is 59% in November 2020 and the lowest is 17% in June 2021.
Americans' worry about hospital capacity has followed the same general pattern as overall concern about getting COVID-19. That is, when hospitals have been overwhelmed, worry about the availability of hospital supplies, services and treatment has risen. The current 33% of U.S. adults who are very or somewhat worried about them marks a 10-point decrease from September, yet it remains higher than readings in the spring, when cases were low and hospitals were not overly stressed.
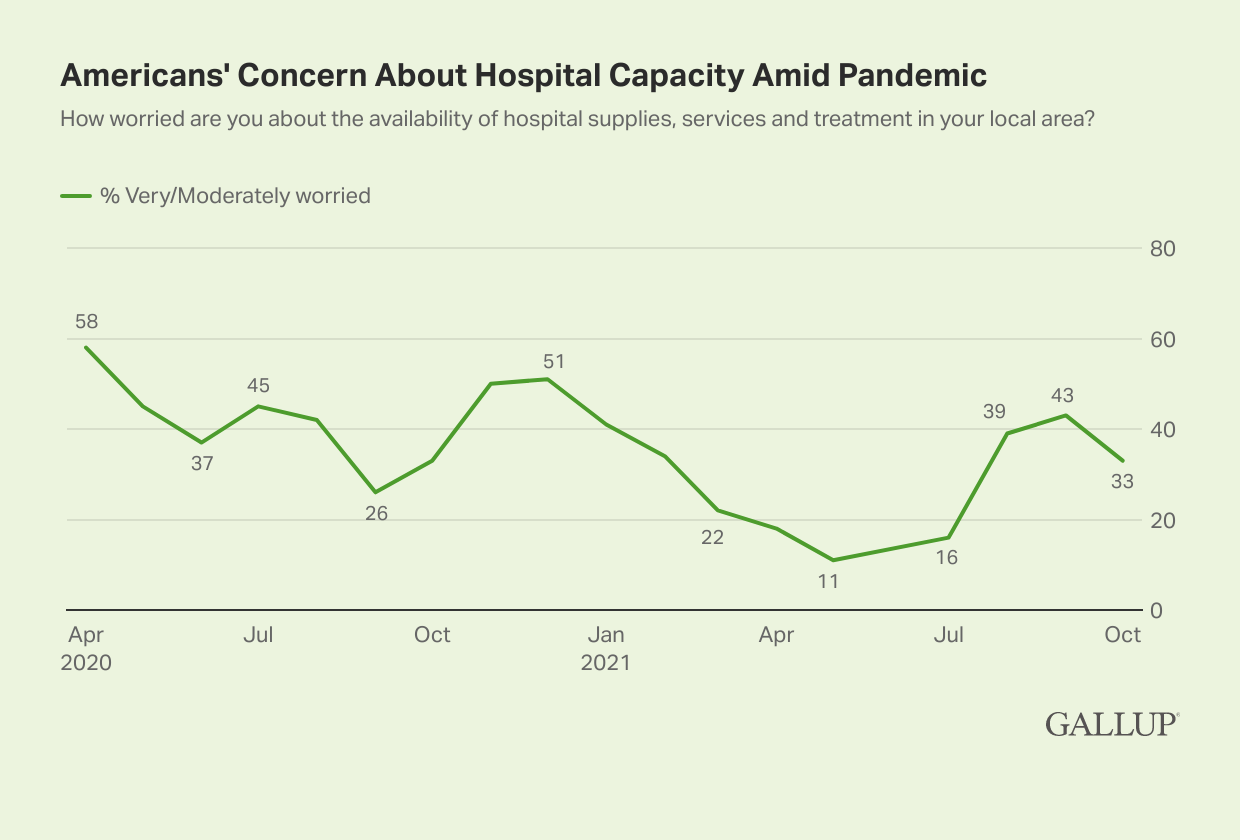
Line graph. Percentage of Americans who are very or moderately worried about the availability of hospital supplies, services and treatment in their local area, from April 2020 to October 2021. The current 33% is down from 43% in September. The highest on record was 58% in April 2020.
Americans Continue to Take Long-Range View of Pandemic Disruptions
Despite the latest positive swing in views of the pandemic, Americans persist in their belief that the level of disruption that is occurring to travel, school, work and public events in the U.S. will continue through the end of 2022 (51%) or longer (28%).
| Oct 2021 | |
|---|---|
| % | |
| A few more weeks | 1 |
| A few more months | 20 |
| Through the end of 2022 | 51 |
| Longer than that | 28 |
| GALLUP, Oct. 18-24, 2021 | |
Americans have been living with the COVID-19 pandemic since March 2020. When it began, the public largely expected it would be gone in a matter of a few weeks or months. Over time, although they have experienced periods of hope, such as when the vaccine was first approved and just before the delta variant tore through the U.S., they have largely believed COVID-19 would upend their lives for a significant period of time.
To stay up to date with the latest Gallup News insights and updates, follow us on Twitter.
Learn more about how the Gallup Panel works.