Story Highlights
- 60% in U.S. are satisfied with position of women in the nation
- 56% of women, 66% of men are satisfied with women's position
- Republicans, adults without college degree more satisfied than counterparts
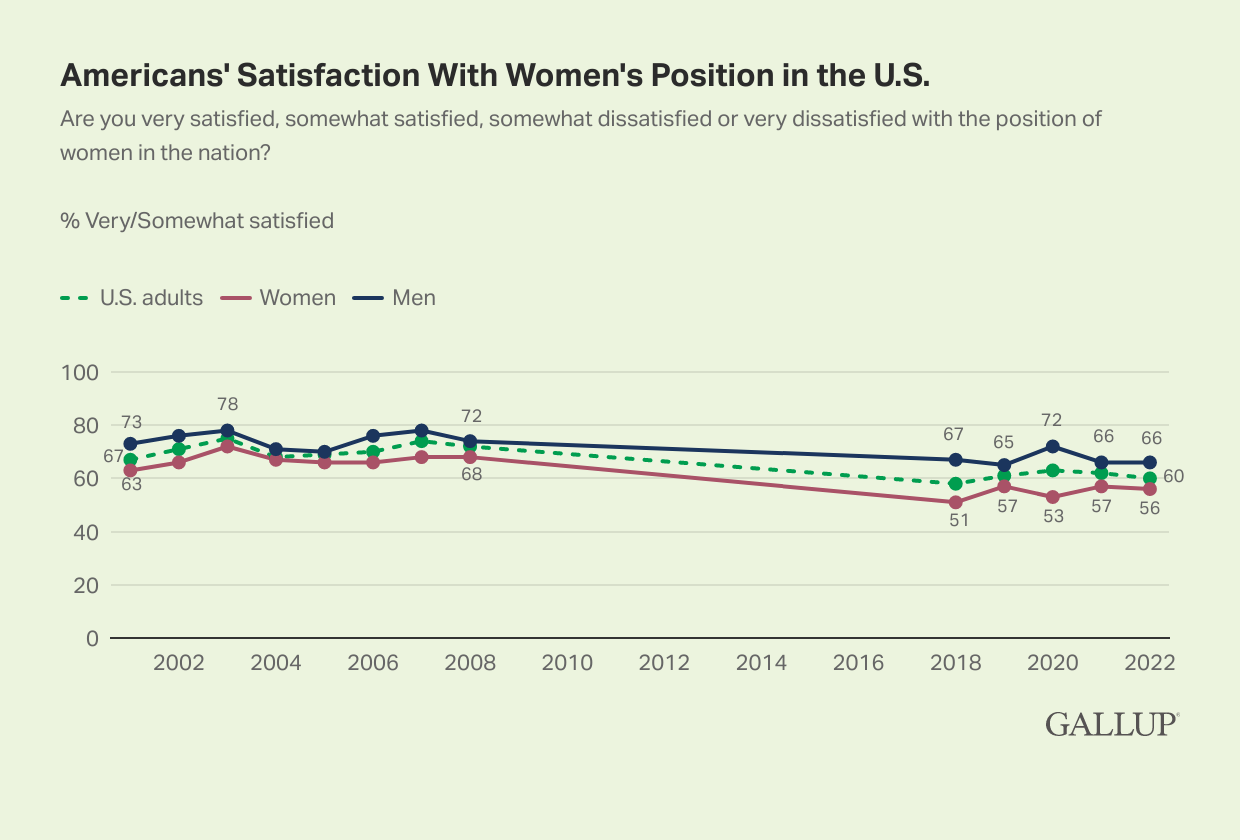
WASHINGTON, D.C. -- Six in 10 Americans are satisfied with the position of women in the U.S., which is similar to what Gallup has found over the past four years but well below the average of 71% from 2001 through 2008.
As has typically been the case, women are less satisfied than men with their gender's position in society, and this year's 10-percentage-point gender gap nearly matches the average gap since 2001.

Line graph. The percentages of U.S. adults, women and men who are very or somewhat satisfied with the position of women in the nation, trend from 2001-2022. There were no readings from 2009 through 2017. The latest findings show 60% of U.S. adults, 66% of men and 56% of women are very or somewhat satisfied. These readings are generally in line with those since 2018, but lower than the 2001-2008 readings.
This measure of Americans' satisfaction with women's position in the U.S. dates back to 2001, but it was not tracked between 2009 and 2017.
The latest findings are from Gallup's annual Mood of the Nation poll, conducted Jan. 3-16, 2022, about four years after the #MeToo movement emerged in the U.S. and shined a light on widespread sexual harassment and misconduct against women. In the wake of the movement, women's satisfaction with the position of women hit a new low of 51% in 2018 and has not recovered much since then.
Democrats, College-Educated Adults Are Less Satisfied Than Counterparts
Some demographic subgroups of Americans are more satisfied than others with the position of women in the U.S.:
Republicans are more satisfied than Democrats.
-
Republicans and Republican-leaning independents (74%) are more likely than Democrats and Democratic-leaning independents (45%) to be satisfied with women's position in the U.S.
-
Republican women and men are about equally satisfied, but Democratic women (41%) are less satisfied than Democratic men (51%).
Americans without college degrees are more satisfied than those with degrees.
-
U.S. adults without a college degree (63%) are more satisfied with the position of women than those with a degree (56%).
-
There is no difference in the satisfaction levels of men with and without college degrees, but women with a college degree (46%) are less satisfied than those without one (62%).
| Very/Somewhat satisfied | |
|---|---|
| % | |
| Gender by Party Identification | |
| Democrats/Leaners women | 41 |
| Republicans/Leaners women | 74 |
| Democrats/Leaners men | 51 |
| Republicans/Leaners men | 75 |
| Gender by College Education | |
| Women without college degrees | 62 |
| Women who are college graduates | 46 |
| Men without college degrees | 66 |
| Men who are college graduates | 67 |
| Gallup | |
Bottom Line
Americans' satisfaction with the position of women in the nation has been steady near 60% since 2018. This level of satisfaction is lower than it was in the first decade of the 21st century, before the explosion of the #MeToo movement in the U.S.
The recent lower level of satisfaction persists even as more women than ever before serve as CEOs of Fortune 500 companies, and female representation is likewise up in the U.S. government, including the vice presidency and U.S. Congress.
Read more stories about women around the world on our International Women's Day page.
To stay up to date with the latest Gallup News insights and updates, follow us on Twitter.
Learn more about how the Gallup Poll Social Series works.


