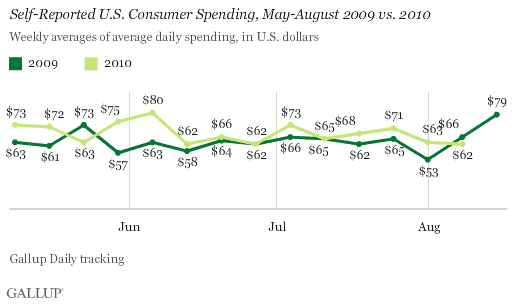
PRINCETON, NJ -- Americans' self-reported spending in stores, restaurants, gas stations, and online averaged $62 per day during the week ending Aug. 8. Early August consumer spending trends trail 2009 and will need to surge to match last year's anemic back-to-school results.

Self-Reported Spending Implies Weak Back-to-School Sales
Gallup's consumer spending measure averaged $68 per day in July compared with $67 per day in June. This is consistent with the "mixed" chain store sales reported in July and the consensus expectation of a 0.2% increase in retail sales, excluding auto sales, when the Commerce Department reports on Friday. Retail sales is a broader measure -- it includes the total receipts at stores selling durable and nondurable goods -- than Gallup's spending measure, which is more oriented toward discretionary spending, but the two measures often trend together when auto sales are excluded.
More importantly, Gallup's weekly spending measure for the first week of August shows no improvement over that of the last week in July or that of the same week a year ago. In turn, this suggests that back-to-school sales are unlikely to substantially exceed last year's depressed levels. In fact, this week's comparable of a year ago was a big spending week, making for challenging sales comparables for many retailers this year.
Gallup's Economic Confidence Index showed a slight uptick last week, suggesting that the preliminary estimate from the Reuters/University of Michigan Consumer Sentiment Index is also likely to show a modest improvement compared with July. This could provide some cheer for Wall Street and hope for the nation's retailers. However, much of that improvement may have been a result of the stunning performance of the stock market in July. Wednesday's plunge in the equity markets is not likely to help economic confidence or consumer spending in the immediate term.
Importantly, Gallup's Job Creation Index finds more companies hiring during this back-to-school season compared with a year ago. Still, weak sales will make it difficult for retailers or small businesses to turn any temporary jobs added for back-to-school into the permanent jobs the economy so desperately needs right now.
Gallup.com reports results from these indexes in daily, weekly, and monthly averages and in Gallup.com stories. Complete trend data are always available to view and export in the following charts:
Daily: Employment, Economic Confidence and Job Creation, Consumer Spending
Weekly: Employment, Economic Confidence, Job Creation, Consumer Spending
Read more about Gallup's economic measures.
Results are based on telephone interviews conducted as part of Gallup Daily tracking with a random sample of 1,000 adults, aged 18 and older, living in all 50 U.S. states and the District of Columbia, selected using random-digit-dial sampling.
For results based on the total sample of national adults averaging 3,000 interviews, one can say with 95% confidence that the maximum margin of sampling error is ±3 percentage points.
Interviews are conducted with respondents on landline telephones and cellular phones, with interviews conducted in Spanish for respondents who are primarily Spanish-speaking. Each daily sample includes a minimum quota of 150 cell phone respondents and 850 landline respondents, with additional minimum quotas among landline respondents for gender within region. Landline respondents are chosen at random within each household on the basis of which member had the most recent birthday.
Samples are weighted by gender, age, race, Hispanic ethnicity, education, region, adults in the household, cell phone-only status, cell phone-mostly status, and phone lines. Demographic weighting targets are based on the March 2009 Current Population Survey figures for the aged 18 and older non-institutionalized population living in U.S. telephone households. All reported margins of sampling error include the computed design effects for weighting and sample design.
In addition to sampling error, question wording and practical difficulties in conducting surveys can introduce error or bias into the findings of public opinion polls.
For more details on Gallup's polling methodology, visit https://www.gallup.com/.
