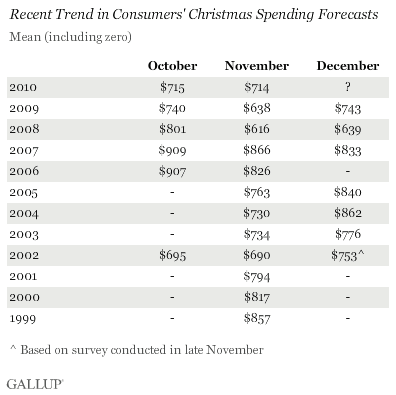
PRINCETON, NJ -- Americans currently predict they will spend $714 on Christmas gifts this year -- well exceeding the $638 they forecast in November a year ago for the 2009 holiday season, but still trailing the pre-recessionary November forecasts recorded over most of the last decade.

The findings are from a Gallup poll conducted Nov. 4-7, 2010, in which respondents were asked to predict the total amount they will spend on Christmas gifts this year. The current forecast is nearly identical to Americans' October prediction of $715.
According to Gallup modeling, if the figure holds at this level through December, that would point to a roughly 2% year-over-year increase in holiday sales. Further, if consumers' spending estimate increases between November and December, as it typically does, actual retail sales could improve by closer to 4%, similar to the long-term average.

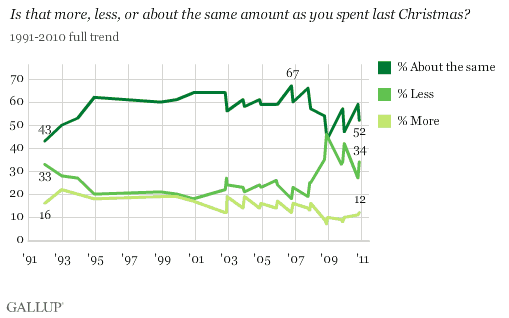
A Relatively High 34% Will Spend "Less" on Gifts This Year
Although the majority of Americans, 52%, say they will spend the same on gifts this year as in 2009, roughly a third of Americans, 34%, say they will spend less, compared with 12% saying they will spend more. That 22-percentage-point gap is nearly double the average 13-point difference between these figures over the past 20 years -- providing a note of caution to Americans' dollar spending forecast.
The current gap contrasts with a 39-point gap found in November 2008, amid the turmoil of the global economic collapse. However, in periods of relative economic prosperity, such as from 1995 through 2000, the figures were about even.

Implications
Consumers seem on track to increase their Christmas spending this year compared with 2009. The precise percentage increase is unclear, and will likely be reflected in what Americans say about their gift-buying intentions in December. Historically, consumers' estimates of their Christmas spending increase between November and December, and the amount of that increase will indicate whether retailers can expect modest growth or something closer to the average 4% increases enjoyed in the years prior to the latest economic downturn.
Results for this Gallup poll are based on telephone interviews conducted Nov 4-7, 2010, with a random sample of 1,025 adults, aged 18 and older, living in the continental U.S., selected using random-digit-dial sampling.
For results based on the total sample of national adults, one can say with 95% confidence that the maximum margin of sampling error is ±4 percentage points.
Interviews are conducted with respondents on landline telephones (for respondents with a landline telephone) and cellular phones (for respondents who are cell phone-only). Each sample includes a minimum quota of 150 cell phone-only respondents and 850 landline respondents, with additional minimum quotas among landline respondents for gender within region. Landline respondents are chosen at random within each household on the basis of which member had the most recent birthday.
Samples are weighted by gender, age, race, education, region, and phone lines. Demographic weighting targets are based on the March 2009 Current Population Survey figures for the aged 18 and older non-institutionalized population living in continental U.S. telephone households. All reported margins of sampling error include the computed design effects for weighting and sample design.
In addition to sampling error, question wording and practical difficulties in conducting surveys can introduce error or bias into the findings of public opinion polls.
View methodology, full question results, and trend data.
For more details on Gallup's polling methodology, visit https://www.gallup.com/.
