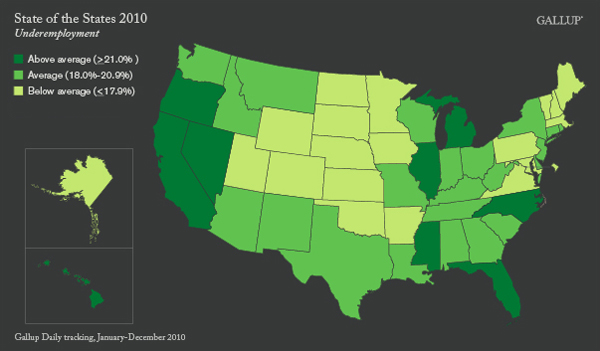
PRINCETON, NJ -- Nationally, 18.9% of Americans were underemployed in 2010, but rates varied substantially across states. A group of six states, mostly in the middle of the country, had underemployment rates of less than 15% in 2010 and of those, only two -- North Dakota and Wyoming -- had less than 12% underemployment. Nine states had underemployment rates of 21% or higher.
 |
| Explore complete state data > |
Underemployed Americans are generally those who are not working to their desired capacity. Gallup considers respondents to be "underemployed" if they are either 1) unemployed or 2) employed part time (under 30 hours per week) and wish to be employed full time. The definition of unemployment used as a component of underemployment closely follows the government's definition; respondents are "unemployed" if they don't have a job, and are actively looking for work and are available to begin work. Gallup reports underemployment by state in the following ranges: 9.0%-11.9%, 12.0%-14.9%, 15.0%-17.9%, 18.0%-20.9%, and 21.0%-24.9%.
The nine states with underemployment rates of 21% or higher were relatively spread out across the country and include the nation's largest state, California, as well as Michigan and Nevada, which have been hit by downturns in the automotive and gambling industries, respectively. Twenty-two states cluster in the underemployment range of 18% to 20.9%, relatively close to the 18.9% national average.
View underemployment data for every state
Underemployment is related to, but does not necessarily follow the state-by-state patterns of, other economic measures. North Dakota, for example, is in the top 10 states of the union not only in terms of underemployment, but also on measures of economic confidence and job creation. California is in the bottom 10 states in terms of underemployment and in job creation, but is not among the worst states in terms of economic confidence.
Implications
Underemployment is a measure of the real impact of the job situation in the U.S., taking into account as it does workers who are out of and explicitly looking for work, as well as those who may be working part time but would like to work full time. The extent of underemployment in the U.S. varies widely by state, from relatively low levels in the energy states of North Dakota and Wyoming to quite high levels in a number of states, including the nation's largest, California.
Gallup did not measure underemployment at the state level in 2009, so it is not possible at this juncture to track state-by-state trends over time. Gallup, however, tracks daily underemployment at the national level in the United States and will provide year-over-year state-level trends in the future.
Survey Methods
Results are based on telephone interviews conducted as part of Gallup Daily tracking for 2010, with a random sample of 213,088 adults, aged 18 and older, living in all 50 U.S. states and the District of Columbia, selected using random-digit-dial sampling.
For results based on the total sample of national adults, one can say with 95% confidence that the maximum margin of sampling error is ±1 percentage point.
The margins of error are no greater than ±7 percentage points for any state, and are ±4 points or less for most states. The margin of error for the District of Columbia is ±9 percentage points.
Interviews are conducted with respondents on landline telephones and cellular phones, with interviews conducted in Spanish for respondents who are primarily Spanish-speaking. Each daily sample includes a minimum quota of 200 cell phone respondents and 800 landline respondents, with additional minimum quotas among landline respondents for gender within region. Landline respondents are chosen at random within each household on the basis of which member had the most recent birthday.
Samples are weighted by gender, age, race, Hispanic ethnicity, education, region, adults in the household, cell phone-only status, cell phone-mostly status, and phone lines. Demographic weighting targets are based on the March 2010 Current Population Survey figures for the aged 18 and older non-institutionalized population living in U.S. telephone households. All reported margins of sampling error include the computed design effects for weighting and sample design.
In addition to sampling error, question wording and practical difficulties in conducting surveys can introduce error or bias into the findings of public opinion polls.
For more details on Gallup's polling methodology, visit www.gallup.com.