WASHINGTON, D.C. -- Americans' Healthy Behaviors Index score was 63.8 in May, down from 65.2 in the same month last year. Adults' health habits have been worse in each of the past three months compared with the same months in 2010.

Gallup and Healthways ask at least 1,000 Americans each day about their health behaviors. Specifically, respondents are asked to report on whether they smoke, on how many days in the last week they exercised for at least 30 minutes, if they ate healthy all day "yesterday," and on how many days they consumed five or more servings of fruits and vegetables in the last seven days.
Americans' eating habits are the culprit in the lower Healthy Behaviors Index score. Fewer Americans reported eating healthily in May this year than did so last year, 66.2 vs. 68.2. Similarly, Americans are not eating as many fruits and vegetables on a weekly basis as they did last year. These data reveal that about 4.5 million fewer American adults ate healthy in May this year than did in the same month one year ago.

Frequent Fruit and Vegetable Consumption Down Across Demographic Groups
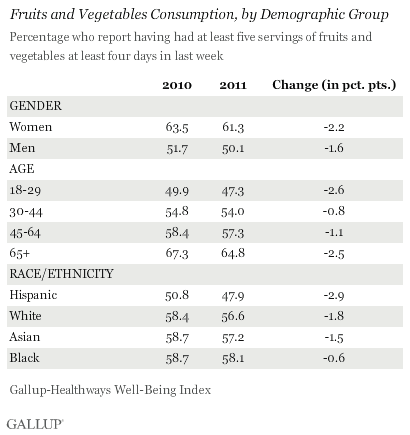
Fewer Americans across major demographic groups are eating fruits and vegetables frequently. However, produce consumption is down the most among Hispanics, young adults, seniors, and women this year compared with 2010.
In particular, Hispanics and young people were by far the least likely to eat produce frequently in 2011, with less than half of each group getting the recommended amount of fruits and vegetables at least four days per week.

Bottom Line
The month of May typically kicks off the four strongest months of the year in overall healthy behaviors for American adults, as seasonal opportunities present themselves and more Americans seek healthier choices. However, Americans' health habits did not increase in May and are worse compared with 2010. Hispanics and young adults are among the most in need of improving their eating habits compared with other deographics. These two groups are not only among the least likely to eat fruits and vegetables frequently, but also their scores have demonstrated the greatest one-year decline in this area.
It is possible that the 2011 decline in the Healthy Behavior Index score is partly a result of sharply increasing gas prices, which may drive some Americans to less expensive, less healthy options. Gas prices were high in the summer of 2008 as well, but those months pre-dated the financial crisis, so the potential effect may have been mitigated.
About the Gallup-Healthways Well-Being Index
The Gallup-Healthways Well-Being Index tracks U.S. and U.K. well-being and provides best-in-class solutions for a healthier world. To learn more, please visit well-beingindex.com.
Survey Methods
For the Gallup-Healthways Well-Being Index, Gallup interviews each day no fewer than 1,000 adults, aged 18 and older, living in all 50 U.S. states and the District of Columbia, selected using random-digit-dial sampling. All samples are near 30,000 per month.
For results based on the total sample of national adults, one can say with 95% confidence that the maximum margin of sampling error is ±0.6 percentage points.
Interviews are conducted with respondents on landline telephones and cellular phones, with interviews conducted in Spanish for respondents who are primarily Spanish-speaking. Each sample includes a minimum quota of 400 cell phone respondents and 600 landline respondents per 1,000 national adults, with additional minimum quotas among landline respondents for gender within region. Landline telephone numbers are chosen at random among listed telephone numbers. Cell phone numbers are selected using random-digit-dial methods. Landline respondents are chosen at random within each household on the basis of which member had the most recent birthday.
Samples are weighted by gender, age, race, Hispanic ethnicity, education, region, adults in the household, and phone status (cell phone only/landline only/both, cell phone mostly, and having an unlisted landline number). Demographic weighting targets are based on the March 2010 Current Population Survey figures for the aged 18 and older non-institutionalized population living in U.S. telephone households. All reported margins of sampling error include the computed design effects for weighting and sample design.
In addition to sampling error, question wording and practical difficulties in conducting surveys can introduce error or bias into the findings of public opinion polls.
For more details on Gallup's polling methodology, visit www.gallup.com.
