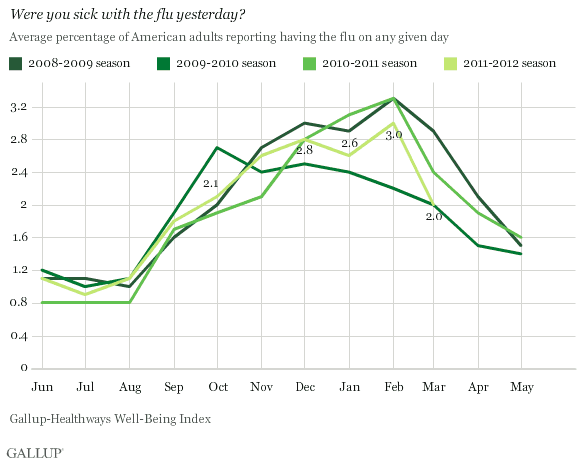
WASHINGTON, D.C. -- U.S. adults' self-reports of having the flu on any given day peaked in February at a 3% and dropped as usual in March, following the typical pattern seen in previous years despite the warmer winter weather this year. Throughout March, an average of 2% of American adults reported having the flu, about on par with March of last year and identical to the level found in March 2010.

The Gallup-Healthways Well-Being Index asks 1,000 Americans each day whether they had a cold or the flu "yesterday."
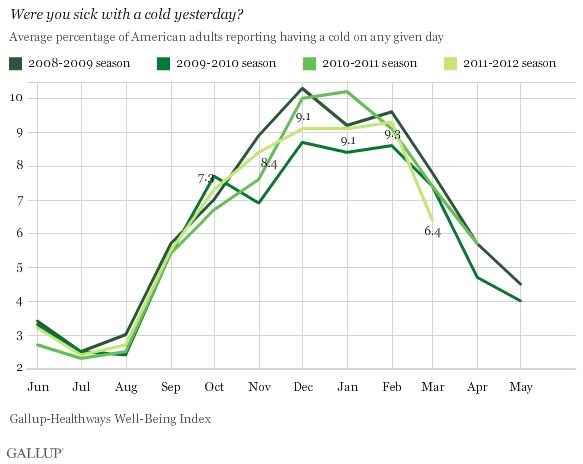
The percentage of Americans who report having the flu or a cold typically increases in the fall, peaks in the winter, and then declines in the spring. All flu and cold seasons have followed this pattern since Gallup and Healthways began tracking these measures in 2008, with the exception of the 2009 to 2010 cold and flu season. During that season, flu incidents peaked in October amid the outbreak of the H1N1 flu virus.
In general, the percentage of Americans who report having a cold yesterday is roughly three times the percentage who report having the flu, which has remained unchanged in the 2011 to 2012 cold and flu season. Reports of colds peaked at 9.3% in February and then fell to 6.4% in March, the lowest level Gallup and Healthways have found for the month of March.

Self-reported cases of colds and the flu in the peak month of February were on par with prior years. In a separate Gallup poll, 79% of all Americans agreed that it was warmer than usual in their local area this winter. Warmer weather generally allows people to spend less time inside where cold and flu viruses tend to spread more rapidly than they do outdoors. However, Americans, for the most part, did not seem to benefit from the unusually warmer temperatures in terms reporting occurrences of colds or the flu.
Measuring colds vs. the flu through survey research is complex because of the overlapping symptoms of the two illnesses and misunderstanding among many Americans regarding what symptoms constitute "the flu" versus "a cold." Additionally, those who have been ill recently may be less willing to take a survey. Still, the opportunity for year-over-year comparisons with previous cold and flu season data provides useful insight into the self-reported prevalence of each condition relative to the other, as well as their respective changes compared with the previous year.
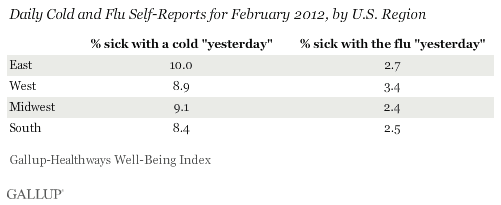
During the Peak Month, Colds Most Prevalent in the East, the Flu in the West
During the peak cold/flu month of February, Americans living in the East (10%) were the most likely to report being sick with a cold. Americans living in the West were the most likely to report being sick with the flu (3.4%).

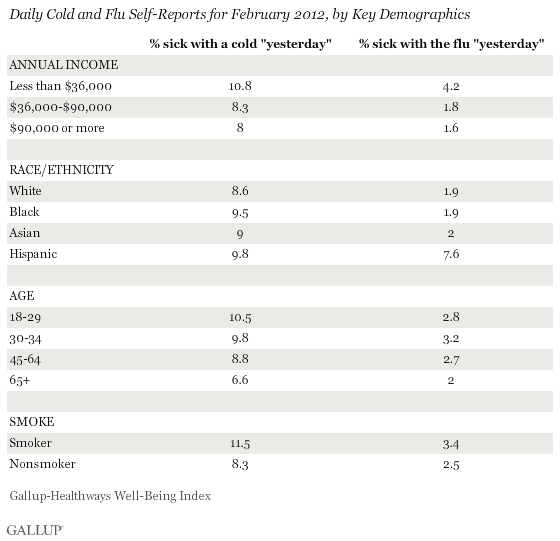
Low-Income Americans and Smokers Most Likely to Report Colds and the Flu
Americans with an annual household income of less than $36,000 were more likely to report having a cold (10.8%) or the flu (4.2%) in the peak month of February than were those with higher incomes. Hispanics were the most likely across races and ethnicities to report having colds and the flu in February. Low-income adults and Hispanics are more likely to be uninsured than other populations, which may prevent them from being able to afford a flu shot. They also might be less likely to get an annual checkup during which a doctor recommends getting a flu shot. Low-income adults also may be likely to use public transit getting to and from work, which can enhance transmission of disease.
Older Americans, who are most likely to have life-threatening complications from the flu, were the least likely across age groups to report having the flu or a cold in February. Almost all seniors have access to healthcare through Medicare and thus are more likely to be able to easily and inexpensively get a flu shot. They are also more likely to be retired and thus spend less time in highly populous environments where flu and cold germs spread. It is also possible that public health campaigns focused on encouraging senior citizens to get a flu shot are a contributing factor to less incidence of colds and the flu among older Americans.
Americans who smoke were much more likely than nonsmokers to have a cold, and slightly more likely to have the flu. According to a study by Carnegie Mellon University, cigarette smoking increases the severity of these illnesses by making it more difficult to breathe. Because it could take smokers longer to recover from the flu and colds, they may be more likely to report being sick with a cold or flu the day before the survey than nonsmokers.

Bottom Line
Generally, the 2011 to 2012 flu and cold season has thus far looked like past seasons. Cold and flu rates were not significantly higher or lower than in previous years. As in past years, the flu and cold rates reached their peak in February before declining in March.
Low-income Americans and smokers are the most likely to report having the flu or a cold, while seniors are among the least likely to do so. Healthcare leaders should consider targeting low-income Americans and smokers in future efforts to reduce the spread and contraction of the flu and colds. Importantly, physicians and employers can communicate to smokers that they are more likely to suffer from colds and the flu than are nonsmokers.
About the Gallup-Healthways Well-Being Index
The Gallup-Healthways Well-Being Index tracks well-being in the U.S., U.K., and Germany and provides best-in-class solutions for a healthier world. To learn more, please visit well-beingindex.com.
Survey Methods
Results are based on telephone interviews conducted as part of the Gallup-Healthways Well-Being Index survey March 1-30, 2012, with a random sample of 31,213 adults, aged 18 and older, living in all 50 U.S. states and the District of Columbia, selected using random-digit-dial sampling.
For results based on the total sample of national adults, one can say with 95% confidence that the maximum margin of sampling error is ±1 percentage point.
Interviews are conducted with respondents on landline telephones and cellular phones, with interviews conducted in Spanish for respondents who are primarily Spanish-speaking. Each sample includes a minimum quota of 400 cell phone respondents and 600 landline respondents per 1,000 national adults, with additional minimum quotas among landline respondents by region. Landline telephone numbers are chosen at random among listed telephone numbers. Cell phone numbers are selected using random-digit-dial methods. Landline respondents are chosen at random within each household on the basis of which member had the most recent birthday.
Samples are weighted by gender, age, race, Hispanic ethnicity, education, region, adults in the household, and phone status (cell phone only/landline only/both, cell phone mostly, and having an unlisted landline number). Demographic weighting targets are based on the March 2010 Current Population Survey figures for the aged 18 and older non-institutionalized population living in U.S. telephone households. All reported margins of sampling error include the computed design effects for weighting and sample design.
In addition to sampling error, question wording and practical difficulties in conducting surveys can introduce error or bias into the findings of public opinion polls.
For more details on Gallup's polling methodology, visit https://www.gallup.com/.
