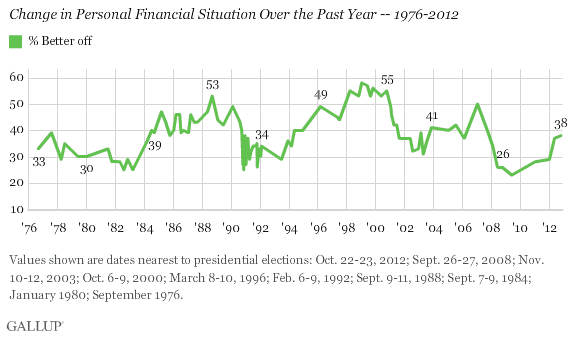
PRINCETON, NJ -- For the first time in more than five years, slightly more Americans are feeling financially better off than they were a year ago, rather than worse off, by 38% to 34%. This represents a significant improvement since May of President Barack Obama's first year as president, when the majority -- 54% -- said they were worse off.

Americans' negative sentiment about their personal finances in 2009 was a holdover from 2008, when the majority said they were worse off financially. Gallup first recorded this in May/June of that year, even before the Wall Street financial collapse in September that sent Americans' confidence in the economy and their standard of living perceptions tumbling.
The new data are based on polling conducted as part of Gallup Daily tracking Oct. 22-23. The 38% of Americans now saying they are financially better off than a year ago is similar to the 37% recorded in May, but is the highest Gallup has recorded in five years, since October 2007.
Evaluations of Current Finances on Par With 2004, 1984
Americans are not as positive today about their personal finances as they were in 1996 before Bill Clinton won a second term. The 49% who felt financially better off in March of that year is the highest Gallup has seen in a year in which an incumbent president runs for re-election.
Still, while fairly low on an absolute basis, the 38% of Americans feeling better off today is on par with what Gallup found before the 2004 and 1984 elections, when Presidents George W. Bush and Ronald Reagan won their re-election bids. Those figures were 41% in November 2003 and 39% in September 1984, respectively.
By contrast, in the three election years when Americans were less upbeat than they are today about their finances -- 1976 (33% felt better off), 1980 (30%), and 1992 (34%) -- the incumbent presidents were defeated.

The political implications of this question are not lost on respondents, who answer in a highly partisan fashion. Six in 10 Democrats (62%) say they are better off than they were a year ago, compared with 34% of independents and 16% of Republicans. By the same token, few Democrats, 9%, say they are worse off, but 40% independents hold this view, as do the majority of Republicans (55%).
Most Are Optimistic About Their Future Finances
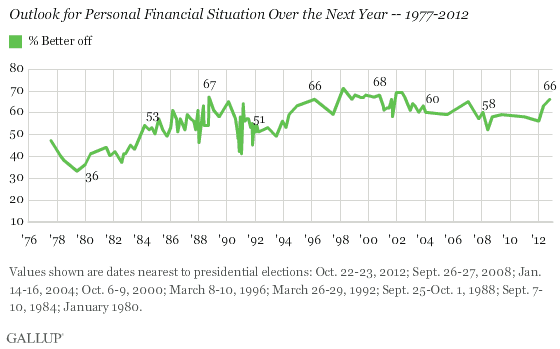
Although Americans' evaluations of their current finances, overall, are fairly tepid, 66% are optimistic when asked whether they expect their financial situations to be better or worse a year from now. This includes 80% of Democrats, but also 62% of independents, and 57% of Republicans.
In recent years, this optimism has dipped as low as 52% (in May/June 2008), but it rebounded to 58% in September of that year, even as the Wall Street financial crisis was still unfolding.

From a longer-term perspective, the 66% believing they will be financially better off a year from now is on the high side of what Gallup has recorded not only in presidential years, but at any time.
Presidents who won re-election did so when Americans' financial optimism was as low as 53% (under Reagan in 1984) and as high as 66% (under Clinton in 1996). Financial optimism under presidents who lost included 36% under Jimmy Carter in 1980 and 51% under George H.W. Bush in 1992.

Bottom Line
Americans' evaluations of their current financial situations are hardly positive, with barely a third saying they are better off than a year ago and nearly as many saying they are worse off. Although an additional 26% say their finances are the same, it is not clear in this slow economy whether that's a good or a bad thing. In any case, positive perceptions on this measure have increased since 2009, which could benefit Obama.
Additionally, two-thirds of Americans, near the record high for this three-decade-long Gallup trend, believe they will be financially better off next year. While that likely reflects Democrats' confidence in Obama, it may also reflect the hopes of some Republicans that their candidate, Mitt Romney, will be the president in a year's time.
Survey Methods
Results are based on telephone interviews conducted as part of Gallup Daily tracking Oct. 22-23, 2012, with a random sample of 1,065 adults, aged 18 and older, living in all 50 U.S. states and the District of Columbia.
For results based on the total sample of national adults, one can say with 95% confidence that the maximum margin of sampling error is ±4 percentage points.
Interviews are conducted with respondents on landline telephones and cellular phones, with interviews conducted in Spanish for respondents who are primarily Spanish-speaking. Each sample includes a minimum quota of 400 cell phone respondents and 600 landline respondents per 1,000 national adults, with additional minimum quotas among landline respondents by region. Landline telephone numbers are chosen at random among listed telephone numbers. Cell phone numbers are selected using random-digit-dial methods. Landline respondents are chosen at random within each household on the basis of which member had the most recent birthday.
Samples are weighted by gender, age, race, Hispanic ethnicity, education, region, adults in the household, and phone status (cell phone only/landline only/both, cell phone mostly, and having an unlisted landline number). Demographic weighting targets are based on the March 2011 Current Population Survey figures for the aged 18 and older non-institutionalized population living in U.S. telephone households. All reported margins of sampling error include the computed design effects for weighting and sample design.
In addition to sampling error, question wording and practical difficulties in conducting surveys can introduce error or bias into the findings of public opinion polls.
View methodology, full question results, and trend data.
For more details on Gallup's polling methodology, visit www.gallup.com.
