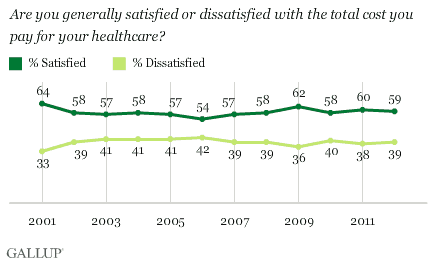
PRINCETON, NJ -- Fifty-nine percent of Americans are satisfied with the total cost they pay for healthcare, precisely in the middle of the 54% to 64% range in satisfaction Gallup has found since 2001.

However, the general stability in overall satisfaction masks a growing gap in satisfaction between Medicaid or Medicare recipients and those who are privately insured. Medicaid and Medicare recipients' satisfaction with what they pay for healthcare has risen to a new high the last two years, at 76%, while those who have private insurance have become slightly less satisfied, at 57%. As a result, there is now a 19-percentage-point gap in the two groups' satisfaction -- contrasted with minimal gaps from 2004 to 2010 and essentially no gap from 2001 to 2003.

The results are based on Gallup's annual Health and Healthcare poll, conducted Nov. 15-18.
Most Privately Insured Contribute to Premiums, Say Costs Are Rising
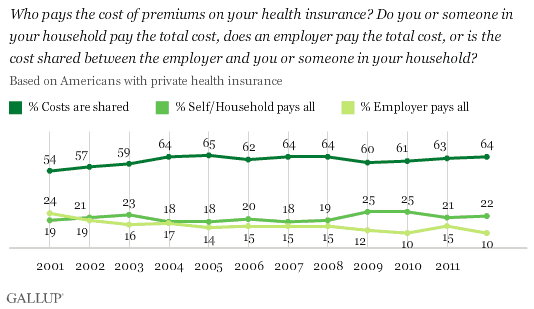
The changing landscape of health insurance in recent decades could be affecting privately insured Americans' satisfaction with their health costs. The vast majority (64%) of Americans with private insurance now say their health premiums costs are shared. This is up from 54% in 2001. While the 22% saying they personally pay the entire cost has not changed appreciably, the 10% saying their employer pays the entire cost is down by more than half from 2001.
The percentage sharing costs has appeared to level off after increasing near the beginning of the last decade.

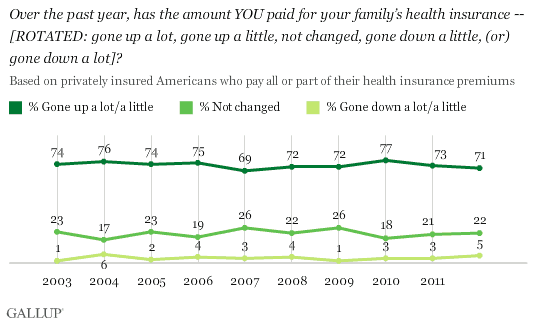
A high percentage of Americans who pay all or part of their health insurance premiums have consistently said throughout the past decade that their health insurance costs have increased in the past year. Currently, 71% say their costs have gone up in the past year, including 29% who say their costs have increased a lot. Meanwhile, 22% say their cost share has not changed, while 5% report a decrease.
Since Gallup first asked the question in 2003, at least 69% Americans paying their health premiums say their personal share has increased.

A major development in the U.S. healthcare system has yet to fully take effect, the implementation of the 2010 Affordable Care Act. It is not yet clear what impact the law is having, or will have, on Americans' attitudes about their own healthcare. However, Medicaid and Medicare recipients' satisfaction with what they pay has increased slightly since the bill passed in 2010, averaging 73%, compared with 67% from 2001 to 2009.
Implications
Despite years of rising costs and the uncertainty about the effects of the 2010 health reforms on patient costs, Americans remain largely satisfied with what they personally pay for healthcare. That is in stark contrast to their widespread dissatisfaction -- 77% are dissatisfied -- with the cost of healthcare in the U.S. more broadly.
There is a widening gap in satisfaction with personal health costs among those who receive their insurance from the federal government in the form of Medicare or Medicaid and those who are privately insured. Though a majority of both groups remain satisfied, Medicaid and Medicare recipients' satisfaction with their costs is reaching new heights, while privately insured Americans' satisfaction is declining.
If this pattern persists, U.S. adults' overall satisfaction with what they pay for healthcare could stay steady or even rise as more Americans qualify for Medicare and Medicaid. This would include the millions of baby boomers who will reach the qualifying age for Medicare in the coming years and others who will become eligible for Medicaid as the 2010 health law increases the qualifying income level.
As such, it will be important for private insurers to attempt to narrow the emerging gap in satisfaction with health costs to remain an appealing option for those who have the option to choose which type of healthcare coverage to use.
Survey Methods
Results for this Gallup poll are based on telephone interviews conducted Nov. 15-18, 2012, with a random sample of 1,015 adults, aged 18 and older, living in all 50 U.S. states and the District of Columbia.
For results based on the total sample of national adults, one can say with 95% confidence that the maximum margin of sampling error is ±4 percentage points.
For results based on the sample of 420 adults with Medicare or Medicaid health insurance, the maximum margin of sampling error is ±6 percentage points.
For results based on the sample of 499 adults with private health insurance, the maximum margin of sampling error is ±6 percentage points.
For results based on the sample of 431 adults with private health insurance who pay all or part of their health premiums, the maximum margin of sampling error is ±6 percentage points.
Interviews are conducted with respondents on landline telephones and cellular phones, with interviews conducted in Spanish for respondents who are primarily Spanish-speaking. Each sample includes a minimum quota of 400 cellphone respondents and 600 landline respondents per 1,000 national adults, with additional minimum quotas among landline respondents by region. Landline telephone numbers are chosen at random among listed telephone numbers. Cellphone numbers are selected using random-digit-dial methods. Landline respondents are chosen at random within each household on the basis of which member had the most recent birthday.
Samples are weighted by gender, age, race, Hispanic ethnicity, education, region, adults in the household, population density, and phone status (cellphone only/landline only/both, cellphone mostly, and having an unlisted landline number). Demographic weighting targets are based on the March 2011 Current Population Survey figures for the aged 18 and older population living in U.S. All reported margins of sampling error include the computed design effects for weighting.
In addition to sampling error, question wording and practical difficulties in conducting surveys can introduce error or bias into the findings of public opinion polls.
View methodology, full question results, and trend data.
For more details on Gallup's polling methodology, visit https://www.gallup.com/.
