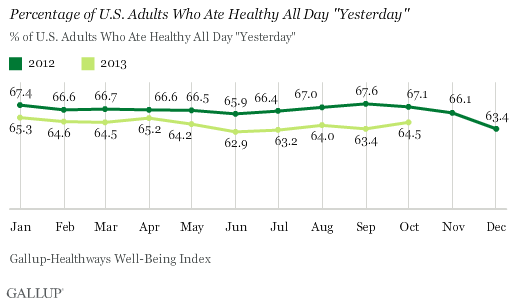
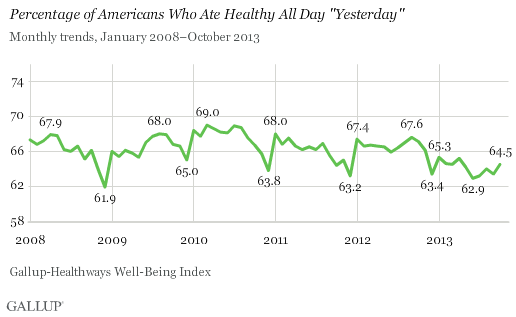
WASHINGTON, D.C. -- Americans' eating habits have deteriorated in 2013, as fewer adults report eating healthy all day "yesterday" in every month so far this year compared with the same months in 2012. In particular, healthy eating in June, July, August, and September declined by at least three percentage points from the same months in 2012. Moreover, in most months this year, healthy eating has been at its lowest in Gallup trends since 2008.

Gallup and Healthways ask at least 500 Americans each day about their eating habits as part of the Gallup-Healthways Well-Being Index.
Healthy eating generally follows a seasonal pattern, gradually declining in the spring, ticking up in the late summer months, and then falling steeply in November and December. The increase between December 2012 and January 2013 was 1.9 percentage points, which is lower than the typical New Year's uptick. Additionally, May and June 2013 brought steeper-than-usual declines.

Produce Consumption Also Declined in Most Months Compared With 2012
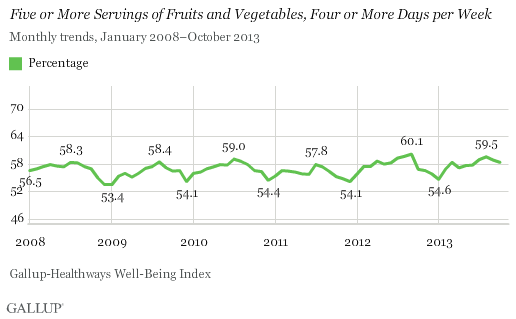
In terms of a more specific dietary practice, fewer Americans have reported eating at least five servings of fruits and vegetables at least four days per week in most months so far in 2013 compared with the same months in 2012. The only exceptions were March and October. This decline in produce consumption could be related to the worsening of Americans' self-reported eating habits.

Implications
Healthy eating, which is linked to lower risk of obesity, is down for all months in 2013 when compared with 2012. Additionally, the percentage of Americans who report eating five or more servings of fruits and vegetables at least four times a week has dropped in eight out of 10 months so far in 2013. Both healthy eating and produce consumption tend to decrease in November and December, likely attributable to Americans' indulging during the holiday season. As the U.S. obesity rate continues to increase across almost all demographic groups, it is critical that Americans begin to eat healthier and exercise more.
Physicians also have an important role to play in improving Americans' eating habits, given their ability to advise patients about best dietary practices. Last summer, 66% of Americans told Gallup their physician speaks with them about the benefits of a healthy diet. That may go up, now that the American Medical Association has classified obesity as a disease, possibly encouraging more doctors to try to positively influence their patients' dietary choices. Additionally, according to Gallup data, doctors themselves are more likely to have a healthy diet and to frequently consume produce than other employed adults, potentially making their message more credible.
Still, individuals themselves have the greatest ability to reduce obesity by choosing to eat healthier and exercise more.
Survey Methods
Results are based on telephone interviews conducted as part of the Gallup-Healthways Well-Being Index survey Jan. 1-Oct. 31, 2013, with a random sample of 150,600 adults, aged 18 and older, living in all 50 U.S. states and the District of Columbia.
For results based on the total sample of national adults, the margin of sampling error is ±0.5 percentage points at the 95% confidence level.
Interviews are conducted with respondents on landline telephones and cellular phones, with interviews conducted in Spanish for respondents who are primarily Spanish-speaking. Each sample of national adults includes a minimum quota of 50% cellphone respondents and 50% landline respondents, with additional minimum quotas by region. Landline and cell telephone numbers are selected using random-digit-dial methods. Landline respondents are chosen at random within each household on the basis of which member had the most recent birthday.
Samples are weighted to correct for unequal selection probability, nonresponse, and double coverage of landline and cell users in the two sampling frames. They are also weighted to match the national demographics of gender, age, race, Hispanic ethnicity, education, region, population density, and phone status (cellphone only/landline only/both, and cellphone mostly). Demographic weighting targets are based on the March 2012 Current Population Survey figures for the aged 18 and older U.S. population. Phone status targets are based on the July-December 2011 National Health Interview Survey. Population density targets are based on the 2010 census. All reported margins of sampling error include the computed design effects for weighting.
In addition to sampling error, question wording and practical difficulties in conducting surveys can introduce error or bias into the findings of public opinion polls.
For more details on Gallup's polling methodology, visit www.gallup.com.
