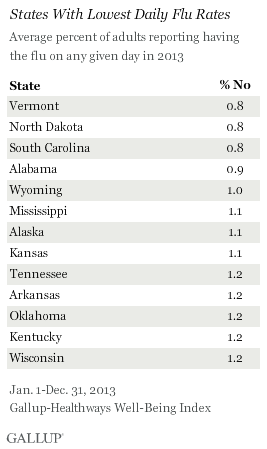
WASHINGTON, D.C. -- Adults living in Nevada (2.9%) were the most likely to report being sick with the flu on any given day in 2013, with California (2.6%) and New York (2.5%) residents trailing closely behind. Vermont, North Dakota, and South Carolina have the lowest flu rates, with each averaging .8%.
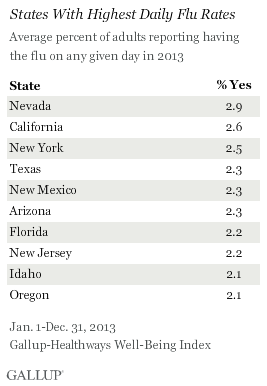
California is the only state to have one of the 10 highest flu rates in the nation every year since Gallup and Healthways began tracking Americans' reports of the flu daily in 2008. Florida, Texas, and New Mexico ranked among the top 10 states for five out of the last six years. These states also have high percentages of residents who lack health insurance, which may make it more difficult for residents to afford flu shots. Additionally, these states, as well as New York, Arizona, and New Jersey, have some of the largest Hispanic populations in America. Gallup has found that Hispanics are more likely than any other major demographic group to report being sick with the flu. Hispanics are also the most likely subgroup to lack health insurance.
 |
| Explore complete state data > |
Mississippi is the only state to have one of the 10 lowest flu rates every year since 2008, though North Dakota has been on this list five of the last six years. South Carolina and Vermont ranked among the states with the 10 lowest flu rates for four out of the last six years.
National flu average remained steady in 2013 at 2.0%, slightly below the high of 2.2% recorded in 2008.
The Gallup-Healthways Well-Being Index asks 500 Americans each night whether they had the flu or a cold "yesterday." Those who are sick with the flu or a cold may be less likely to respond to a phone survey, so these percentages may underestimate the actual prevalence. Additionally, since Americans self-report whether they have the flu or a cold, those with a cold may actually have the flu and vice versa. Cultural differences and age may also play a role, as certain subgroups may be more likely to self-diagnose themselves with having the flu or a cold. Still, year-over-year comparisons with data from previous years provides useful insights into respective changes within states compared with previous years.
Self-Reports of Colds Highest in Montana, Lowest in Arizona
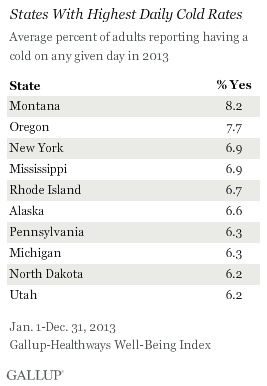
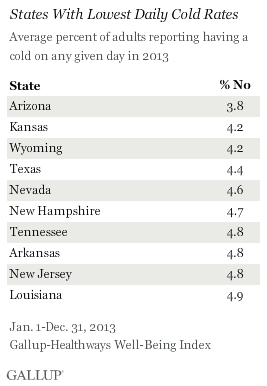
Montana residents (8.2%) were the most likely to report being sick with a cold on any given day, with Oregon (7.7%), New York (6.9%), and Mississippi (6.9%) close behind. Cold rates were lowest in Arizona (3.8%), followed by Kansas and Wyoming (both at 4.2%).
Bottom Line
National flu rates in 2013 were on par with those measured in previous years. California, Florida, Texas, and New Mexico suffer from higher flu rates, as has been the case since tracking began in 2008. These states have high percentages of residents who lack health insurance and large Hispanic populations, which may be contributing to the consistently higher flu rates in these states. These populations may be less able to afford or have access to flu shots, which would make them more vulnerable to infection. Additionally, different stands of the flu virus may impact flu rates across regions.
States, especially those with high levels of flu and cold rates, may need to increase efforts to ensure they are targeting these populations. These states may also want to target populations who are more likely to experience serious health effects from the flu, including young children, pregnant women, older people, and those with certain health conditions such as asthma.
The flu imposes a significant cost on the U.S. economy. The CDC reports that the flu costs businesses approximately $10.4 billion every year in direct costs for hospitalizations and outpatients visits for adults. This figure does not include losses due to lower productivity.
The Affordable Care Act requires most health plans to provide preventative health services, including the flu shot, at no cost. Physicians and public health officials could help lower flu rates and reduce the overall economic impact of the flu by educating Americans about this provision. Additionally, employers can encourage workers to get a flu shot and provide opportunities for workers to do so.
Gallup's "State of the States" series reveals state-by-state differences on political, economic, and well-being measures Gallup tracks each day. New stories based on full-year 2013 data will be released in the coming months.
Survey Methods
Results are based on telephone interviews conducted as part of the Gallup-Healthways Well-Being Index survey Jan. 2-Dec. 29, 2013, with a random sample of 178,068 adults, aged 18 and older, living in all 50 U.S.
The margin of sampling error for most states is ±1 to ±2 percentage points, but is as high as ±4 points for states with smaller population sizes such as Wyoming, North Dakota, South Dakota, Delaware, and Hawaii.
Interviews are conducted with respondents on landline telephones and cellular phones, with interviews conducted in Spanish for respondents who are primarily Spanish-speaking. Each sample of national adults includes a minimum quota of 50% cellphone respondents and 50% landline respondents, with additional minimum quotas by time zone within region. Landline and cellular telephone numbers are selected using random-digit-dial methods. Landline respondents are chosen at random within each household on the basis of which member had the most recent birthday.
Samples are weighted to correct for unequal selection probability, nonresponse, and double coverage of landline and cell users in the two sampling frames. They are also weighted to match the national demographics of gender, age, race, Hispanic ethnicity, education, region, population density, and phone status (cellphone only/landline only/both, and cellphone mostly). Demographic weighting targets are based on the most recent Current Population Survey figures for the aged 18 and older U.S. population. Phone status targets are based on the most recent National Health Interview Survey. Population density targets are based on the most recent U.S. census. All reported margins of sampling error include the computed design effects for weighting.
In addition to sampling error, question wording and practical difficulties in conducting surveys can introduce error or bias into the findings of public opinion polls.
For more details on Gallup's polling methodology, visit www.gallup.com.
