PRINCETON, NJ -- Four percent of Americans are newly insured this year, reporting that they have health insurance now but did not last year. A little more than half of that group, or 2.1% of the U.S. population, got their new insurance through health exchanges. The rest got it using some other mechanism.
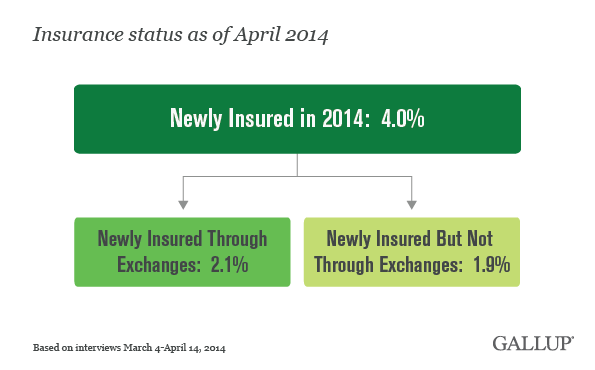
These findings are based on interviewing with more than 20,000 U.S. adults, aged 18 and older, conducted as part of Gallup Daily tracking from March 4-April 14. Gallup asked those who have health insurance if their policy is new for 2014, and if so, whether they had insurance last year and if they got their new insurance through a federal or state health exchange.
Overall, 11.8% of U.S. adults say they got a new health insurance policy in 2014. One-third of this group, or 4% nationally, say they did not have insurance in 2013. Another 7.5% got a new policy this year that replaced a previous policy. The rest either did not respond or were uncertain about their previous insurance status.
The key figure is the 4% who are newly insured in 2014, which most likely represents Americans' response to the individual mandate requirement the Affordable Care Act (ACA). This estimate of the newly insured broadly aligns with the reduction Gallup has seen in the national uninsured rate from 2013 to the first days of April 2014. However, the calculation of the newly insured does not take into account those who may have been insured in 2013 but not in 2014.
The ACA envisioned that the new healthcare exchanges would be the main place where uninsured Americans would get their insurance this year, but it appears that a sizable segment of the newly insured Americans used another mechanism. These sources presumably include employee policies, Medicaid, and other private policies not arranged through exchanges.
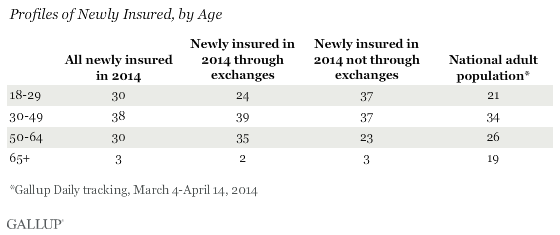
Newly Insured Younger Than General Population
The newly insured are, on average, much younger than the overall population, with most younger than age 65. Within the 18 to 64 age range, the newly insured are slightly more overrepresented in the 18 to 29 age category than in the 30 to 49 and 50 to 64 age categories. These data suggest that the ACA's efforts to add previously uninsured young people to the ranks of the insured have been modestly successful.
The newly insured who signed up outside of the exchanges are substantially younger than those who signed up through the exchanges.
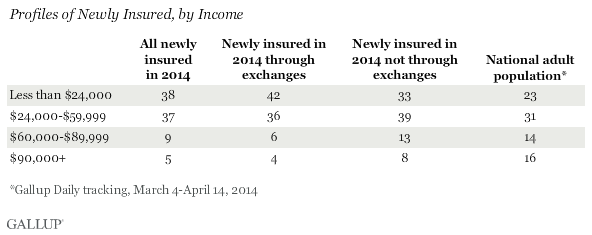
Newly Insured Have Lower Incomes
The newly insured have lower-than-average annual household incomes, as might be expected. This skew toward the lowest income categories is particularly prevalent among those who signed up through the exchanges, who are significantly more likely than the overall population to be in the less than $24,000 household income category. This low-income skew among those who used the exchanges is partly related to their being less likely to be employed full time and more likely to be out of the workforce than those who obtained insurance outside of the exchanges.
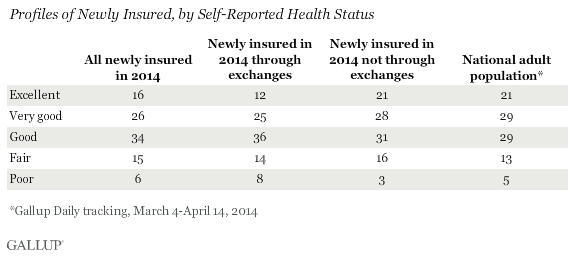
Self-Reported Health of Newly Insured Mirrors National Average
The self-reported health status of the newly insured as a group is not significantly different from the health status of the overall population. Given that those aged 65 and older describe their health in somewhat less positive terms than younger people, and given that the newly insured are mostly younger than 65, this is particularly important. The intent of the individual mandate, broadly speaking, was to bring healthy people -- with their lower probability of needing to use their insurance -- into the healthcare system. A strong skew among the newly insured toward healthier Americans has apparently not yet materialized.
Newly Insured Skew Democratic in Political Orientation
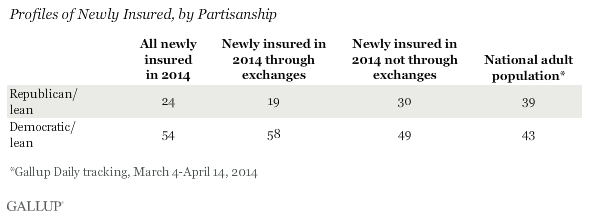
All of the newly insured are more likely to identify with or lean toward the Democratic Party than the overall national adult population. Those who signed up through exchanges are the most likely to tilt Democratic and not Republican.
This political skew in those who have signed up for health insurance reflects two phenomenon. First, being young and having a low income are both associated with a Democratic political orientation. Second, the relationship between Americans' political orientation and their views toward the ACA is well-documented. It is likely that previously uninsured Democrats are more inclined to be sympathetic to the aims of the legislation and to sign up for insurance than are uninsured Republicans.
Survey Methods
Results for this Gallup poll are based on telephone interviews conducted March 4-April 14, 2014, on the Gallup Daily tracking survey, with a random sample of 20,804 adults, aged 18 and older, living in all 50 U.S. states and the District of Columbia.
For results based on the total sample of national adults, the margin of sampling error is ±1 percentage points at the 95% confidence level. For results based on the total sample of 649 adults who are newly insured, the margin of sampling error is ±5 percentage points at the 95% confidence level. For results based on the samples of 356 and 292 adults who are newly insured through exchanges and newly insured not through exchanges, respectively, the margins of sampling errors are ±7 percentage points at the 95% confidence level.
Interviews are conducted with respondents on landline telephones and cellular phones, with interviews conducted in Spanish for respondents who are primarily Spanish-speaking. Each sample of national adults includes a minimum quota of 50% cellphone respondents and 50% landline respondents, with additional minimum quotas by time zone within region. Landline and cellular telephone numbers are selected using random-digit-dial methods. Landline respondents are chosen at random within each household on the basis of which member had the most recent birthday.
Samples are weighted to correct for unequal selection probability, nonresponse, and double coverage of landline and cell users in the two sampling frames. They are also weighted to match the national demographics of gender, age, race, Hispanic ethnicity, education, region, population density, and phone status (cellphone only/landline only/both, and cellphone mostly). Demographic weighting targets are based on the most recent Current Population Survey figures for the aged 18 and older U.S. population. Phone status targets are based on the most recent National Health Interview Survey. Population density targets are based on the most recent U.S. census. All reported margins of sampling error include the computed design effects for weighting.
In addition to sampling error, question wording and practical difficulties in conducting surveys can introduce error or bias into the findings of public opinion polls.
For more details on Gallup's polling methodology, visit www.gallup.com.
