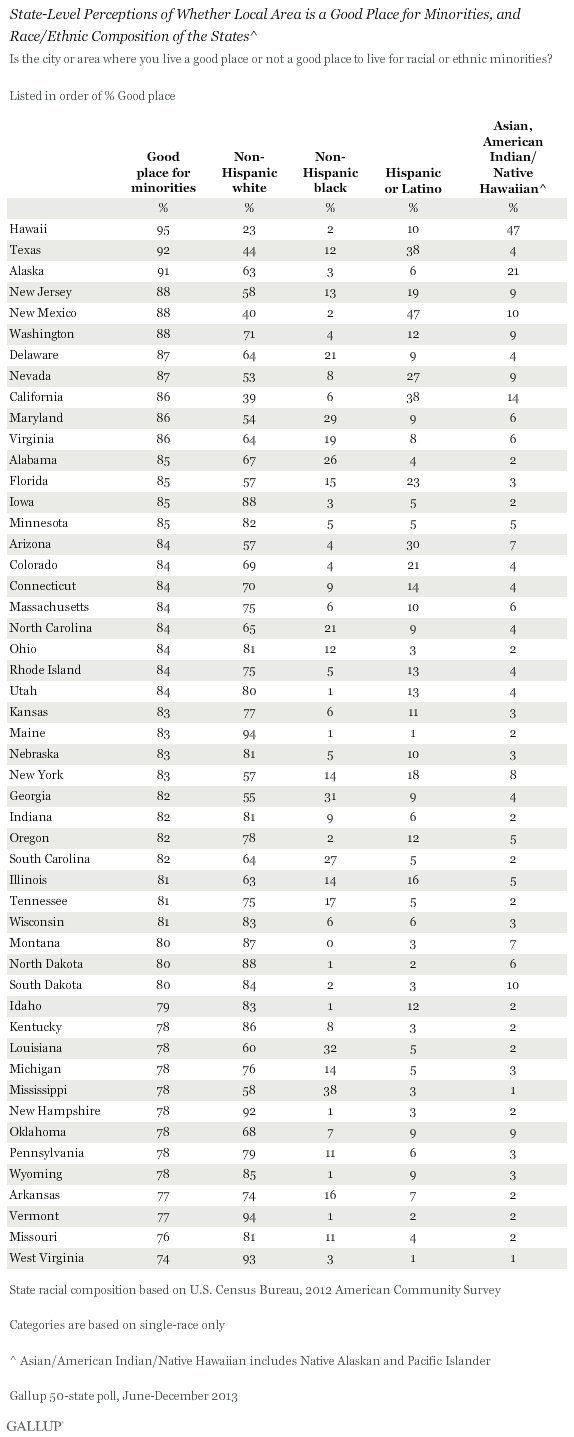
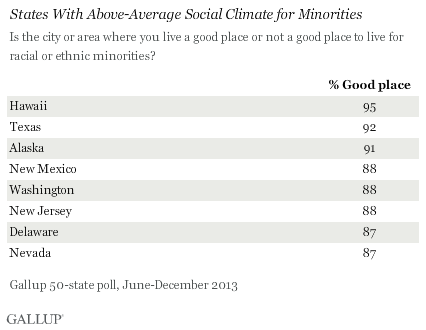
PRINCETON, NJ -- Ninety-five percent of Hawaii's residents consider the city or area in which they live to be a good place for racial and ethnic minorities, earning the Aloha State the top spot in Gallup's 50-state ranking on this measure. Texans and Alaskans are nearly as positive, with more than 90% saying their locales are good places for minorities to live.
These results come from a 50-state Gallup poll conducted June-December 2013, with at least 600 residents in each state. The full results for each state are shown on page 2.
Nearly nine in 10 residents in an additional five states -- New Mexico, Washington, New Jersey, Delaware, and Nevada -- see their social climates as positive for minorities, all above Gallup's 50-state average of 83%.
West Virginians Are Least Positive About Climate for Minorities
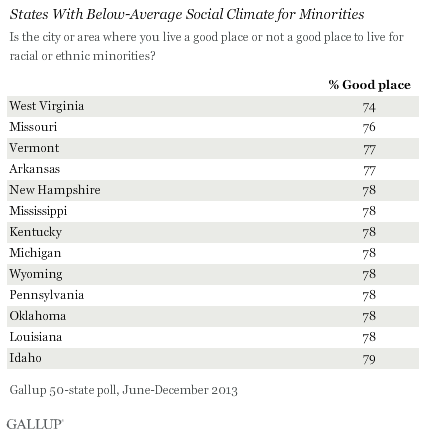
No state performs terribly on this measure; in fact, solid majorities in all states think where they live is good for minorities. However, residents in 13 states register below-average scores of between 74% and 79%. West Virginia, at 74%, is the only state in which fewer than three-quarters of its residents are positive. Other states approaching this threshold are Missouri (76%), Vermont (77%), and Arkansas (77%).
Parts of South Least Confident About Climate for Minorities
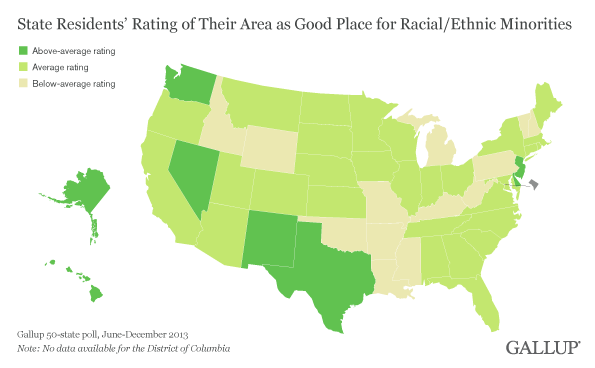
Five of the 13 states where residents are less likely than average to believe their communities are good places for racial and ethnic minorities are in the nation's South. These include Louisiana, Arkansas, Oklahoma, Mississippi, and Kentucky. But all other regions of the U.S. are also represented in the bottom-ranking states.
Beyond geography, there is a racial aspect to the states where residents perceive their communities as most and least hospitable to minorities.
All of the eight top-ranking states have relatively large minority populations of one race/ethnicity or another. Two -- Texas and New Mexico -- have large Hispanic populations. Two others -- Hawaii and Washington -- have large Asian or Native Hawaiian populations. And New Jersey and Nevada have fairly high proportions of Hispanics and Asians relative to the country as a whole. Just one state, Delaware, has a relatively high black population.
On the other hand, of the 13 states scoring below average for perceived minority well-being, none has a large Hispanic or Asian population, while four -- Mississippi, Louisiana, Arkansas, and Michigan -- have relatively high proportions of black residents, and Oklahoma has a fairly high proportion of Native Americans.
Still, racial composition alone does not determine residents' views of how hospitable their area is for minorities, because a number of the more racially diverse states such as Florida, Alabama, Arizona, Colorado, and New York, fall near the average in Gallup's ranking as a good place for minorities.
Additionally, all states with large Hispanic or Asian/Native Hawaiian populations rank average or above average. By contrast, several states with large black populations rank below average, with most others average, and only one above average.
Bottom Line
Solid majorities of adult residents in every state in the union consider their area a good place for racial and ethnic minorities, ranging from 74% in West Virginia to 95% in Hawaii.
However, there is a clear race-related pattern, whereby states with large Hispanic or Asian populations all rank average or above average as good for racial/ethnic minorities, whereas states with large black populations tend to rank average or below average -- with Delaware the only exception. While a key to understanding these differences may involve analyzing the results within each state according to residents' racial/ethnic backgrounds, that is not possible with the 50-state survey because of sample size.
Survey Methods
Results for this Gallup poll are based on telephone interviews conducted June-December 2013, with a random sample of approximately 600 adults per state, aged 18 and older, living in all 50 U.S. states.
For results based on the total sample of adults per state, the margin of sampling error is ±5 percentage points at the 95% confidence level.
Interviews are conducted with respondents on landline telephones and cellular phones, with interviews conducted in Spanish for respondents who are primarily Spanish-speaking. Each sample of national adults includes minimum quotas of cellphone respondents and landline respondents based on cellphone and landline use in the respective state. Landline and cellular telephone numbers are selected using random-digit-dial methods. Landline respondents are chosen at random within each household on the basis of which member had the most recent birthday.
Samples are weighted to correct for unequal selection probability, nonresponse, and double coverage of landline and cell users in the two sampling frames. They are also weighted to match the state demographics of gender, age, race, Hispanic ethnicity, education, region, population density, and phone status (cellphone only/landline only/both, and cellphone mostly). Demographic weighting targets are based on the most recent Current Population Survey figures for the aged 18 and older U.S. population. Phone status targets are based on the most recent National Health Interview Survey. Population density targets are based on the most recent U.S. census. All reported margins of sampling error include the computed design effects for weighting.
In addition to sampling error, question wording and practical difficulties in conducting surveys can introduce error or bias into the findings of public opinion polls.
For more details on Gallup's polling methodology, visit www.gallup.com.