
Story Highlights
- Economic Confidence Index averaged -7 in May
- Third straight month in negative territory
- Lowest monthly average since November 2014
WASHINGTON, D.C. -- Gallup's Economic Confidence Index dropped to an average of -7 in May, down from -3 in April. This drop continues the monthly downward drift since confidence peaked at +3 in January, and is the lowest monthly score since the -8 in November 2014. However, confidence remains much higher now than what Gallup has found in most months since Americans started to feel the recession's effects in 2008.
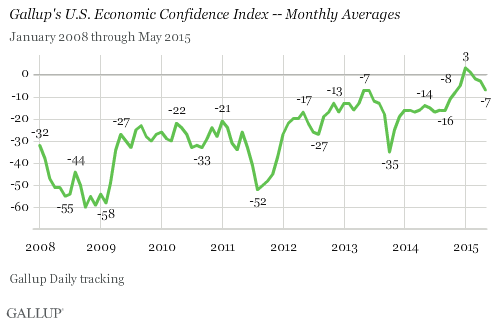
In January, the index averaged +3, the first time since the recession that it had a positive monthly average. This higher confidence was most likely related to a drop in average gas prices across the U.S. However, the index began deteriorating after that and has had negative monthly averages since March, including May's average of -7.
The first week of May was marked by a six-point drop to -9 in average economic confidence, the largest weekly drop since July 2014. Weekly confidence remained low throughout the month, finishing at -7 in the last week.
Gallup's Economic Confidence Index has a theoretical high of +100 and a theoretical low of -100. It would reach +100 if all Americans said the economy is "excellent" or "good" and "getting better," while it would reach -100 if all Americans said the economy is "poor" and "getting worse."
Both Current Conditions and Economic Outlook Components Down
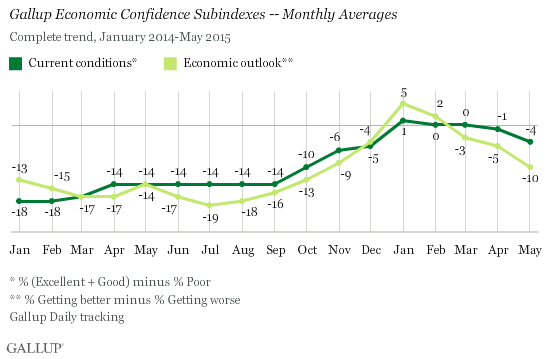
Gallup's Economic Confidence Index is the average of two components: Americans' ratings of current economic conditions and whether they feel the economy is improving or getting worse. Both components dropped between April and May, continuing the downward slide, but expectations about the economy's direction are clearly suffering the most so far this year.
The economic outlook component score was -10 in May, based on 43% of Americans saying the economy is getting better and 53% saying it is getting worse. The outlook score was down five points from the -5 found in April, and is the lowest monthly economic outlook score in Gallup Daily tracking since October.
By contrast, the current conditions score in May was -4, based on 25% of Americans saying the economy is "excellent" or "good" and 29% calling it "poor." The May current conditions score is the lowest since December.
Bottom Line
While there was mixed economic news in May, Americans' confidence in the economy continued to slide from its high point in the first month of 2015. In early May, the U.S. federal government announced that the nation's gross domestic product appeared to have barely increased in the first quarter of the year. A revision released on Friday indicates that the economy actually shrank in the first quarter, partly because of the cold weather and the stronger U.S. dollar. Gas prices across the U.S. continued to rise throughout May, likely making some consumers wary as the summer travel season approaches, even though prices remain lower than in prior years. Meanwhile, U.S. consumer spending was flat in May.
Long-term context is still important. Despite this downward slide, confidence does remain higher than where it has been for most of the past seven years, and is noticeably improved from even this time last year.
These data are available in Gallup Analytics.
Survey Methods
Results for this Gallup poll are based on telephone interviews conducted May 1-31, 2015, on the Gallup U.S. Daily survey, with a random sample of 15,709 adults, aged 18 and older, living in all 50 U.S. states and the District of Columbia. For results based on the total sample of national adults, the margin of sampling error is ±1 percentage point at the 95% confidence level. All reported margins of sampling error include computed design effects for weighting.
Each sample of national adults includes a minimum quota of 50% cellphone respondents and 50% landline respondents, with additional minimum quotas by time zone within region. Landline and cellular telephone numbers are selected using random-digit-dial methods.
Learn more about how Gallup Daily tracking works.