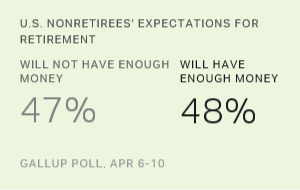
Story Highlights
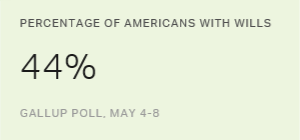
- 44% report having a will
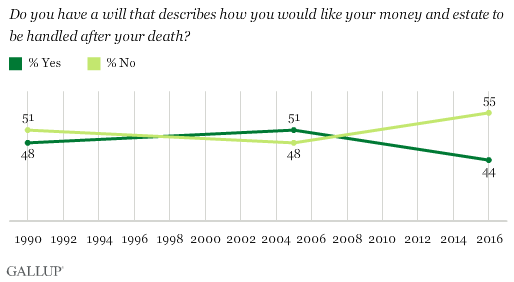
- Percentage was 51% in 2005, 48% in 1990
- Older Americans are more likely to have a will
PRINCETON, N.J. -- Forty-four percent of Americans say they have a will that describes how they would like their money and estate handled after their death. That is lower than in two prior Gallup polls: 51% in 2005 and 48% in 1990.
The issue of wills has been a topic in the news after the untimely death of the musician Prince. His sister filed court papers asserting he did not have a will, and so far, nobody has produced one. While most Americans are not as wealthy as Prince, his not having a will appears to be common in the U.S.
Lawyers and financial advisors recommend people write wills to ensure their wishes for transferring their property and assets are followed and to avoid protracted legal proceedings over the distribution of those assets.
The results are based on a May 4-8 Gallup poll, conducted two weeks after Prince's death. While it is unknown whether major news events that touch on the wishes of the dead or dying can influence Americans' self-reports of having a will, the higher 2005 estimate came in a poll conducted shortly after the Terri Schiavo saga.
Americans' likelihood of having a will depends largely on their age and socioeconomic status. Sixty-eight percent of those aged 65 and older have a will, compared with just 14% of those younger than age 30. Of Americans whose annual household income is $75,000 or greater, 55% have a will, compared with 31% of those with incomes of less than $30,000. And while 61% of those with a postgraduate education have a will, only 32% with a high school education or less do.
Likely reflecting those age and socioeconomic differences, nonwhite adults (28%) are about half as likely as white adults (51%) to have a will.
Given the relationships between age and income and having a will, the percentage who say they have a will rises to 75% among upper-income Americans aged 55 and older.
Since 2005, the percentage of those in most key subgroups who have a will has declined. The major exception is among those with a postgraduate education, for which there has been essentially no change. Declines have been above-average since 2005 in the subgroups that are least likely to have a will -- younger, lower-income, less-educated and nonwhite Americans.
| 2005% | 2016% | Changepct. pts. | |||||||||||||||||||||||||||||||||||||||||||||||||||||||||||||||||||||||||||||||||||||||||||||||||
|---|---|---|---|---|---|---|---|---|---|---|---|---|---|---|---|---|---|---|---|---|---|---|---|---|---|---|---|---|---|---|---|---|---|---|---|---|---|---|---|---|---|---|---|---|---|---|---|---|---|---|---|---|---|---|---|---|---|---|---|---|---|---|---|---|---|---|---|---|---|---|---|---|---|---|---|---|---|---|---|---|---|---|---|---|---|---|---|---|---|---|---|---|---|---|---|---|---|---|---|
| National adults | 51 | 44 | -7 | ||||||||||||||||||||||||||||||||||||||||||||||||||||||||||||||||||||||||||||||||||||||||||||||||
| Age | |||||||||||||||||||||||||||||||||||||||||||||||||||||||||||||||||||||||||||||||||||||||||||||||||||
| 65+ | 78 | 68 | -10 | ||||||||||||||||||||||||||||||||||||||||||||||||||||||||||||||||||||||||||||||||||||||||||||||||
| 50-64 | 63 | 56 | -7 | ||||||||||||||||||||||||||||||||||||||||||||||||||||||||||||||||||||||||||||||||||||||||||||||||
| 30-49 | 43 | 35 | -8 | ||||||||||||||||||||||||||||||||||||||||||||||||||||||||||||||||||||||||||||||||||||||||||||||||
| 18-29 | 24 | 14 | -10 | ||||||||||||||||||||||||||||||||||||||||||||||||||||||||||||||||||||||||||||||||||||||||||||||||
| Annual Household Income | |||||||||||||||||||||||||||||||||||||||||||||||||||||||||||||||||||||||||||||||||||||||||||||||||||
| $75,000 or more | 62 | 55 | -7 | ||||||||||||||||||||||||||||||||||||||||||||||||||||||||||||||||||||||||||||||||||||||||||||||||
| $30,000-$74,999 | 48 | 38 | -10 | ||||||||||||||||||||||||||||||||||||||||||||||||||||||||||||||||||||||||||||||||||||||||||||||||
| Less than $30,000 | 45 | 31 | -14 | ||||||||||||||||||||||||||||||||||||||||||||||||||||||||||||||||||||||||||||||||||||||||||||||||
| Education | |||||||||||||||||||||||||||||||||||||||||||||||||||||||||||||||||||||||||||||||||||||||||||||||||||
| Postgraduate | 60 | 61 | 1 | ||||||||||||||||||||||||||||||||||||||||||||||||||||||||||||||||||||||||||||||||||||||||||||||||
| College graduate only | 54 | 50 | -4 | ||||||||||||||||||||||||||||||||||||||||||||||||||||||||||||||||||||||||||||||||||||||||||||||||
| Some college | 54 | 47 | -7 | ||||||||||||||||||||||||||||||||||||||||||||||||||||||||||||||||||||||||||||||||||||||||||||||||
| High school or less | 45 | 32 | -13 | ||||||||||||||||||||||||||||||||||||||||||||||||||||||||||||||||||||||||||||||||||||||||||||||||
| Race | |||||||||||||||||||||||||||||||||||||||||||||||||||||||||||||||||||||||||||||||||||||||||||||||||||
| White | 55 | 51 | -4 | ||||||||||||||||||||||||||||||||||||||||||||||||||||||||||||||||||||||||||||||||||||||||||||||||
| Nonwhite | 39 | 28 | -11 | ||||||||||||||||||||||||||||||||||||||||||||||||||||||||||||||||||||||||||||||||||||||||||||||||
| Gallup | |||||||||||||||||||||||||||||||||||||||||||||||||||||||||||||||||||||||||||||||||||||||||||||||||||
Implications
Prince's main legacy will undoubtedly be his music, but his unexpected death might leave him with another: an example of what can happen when someone dies without a will. Prince was certainly not alone in not writing a will, as the majority of Americans report they do not have one. Even a substantial minority of older and upper-income Americans -- roughly three in 10 of those aged 65 years and older, and nearly four in 10 of those with household incomes of $100,000 or more -- say they do not have a will.
The legal battles over the distribution of Prince's estate are just beginning, but as those play out in the coming months, it might persuade more Americans to formally and legally spell out their wishes for how to handle their estates after their death.
Historical data are available in Gallup Analytics.
Survey Methods
Results for this Gallup poll are based on telephone interviews conducted May 4-8, 2016, with a random sample of 1,025 adults, aged 18 and older, living in all 50 U.S. states and the District of Columbia. For results based on the total sample of national adults, the margin of sampling error is ±4 percentage points at the 95% confidence level. All reported margins of sampling error include computed design effects for weighting.
Each sample of national adults includes a minimum quota of 60% cellphone respondents and 40% landline respondents, with additional minimum quotas by time zone within region. Landline and cellular telephone numbers are selected using random-digit-dial methods.
View survey methodology, complete question responses and trends.
Learn more about how the Gallup Poll Social Series works.