Story Highlights
- 15.0% of U.S. adults struggled to afford food in past 12 months
- Blacks, Hispanics continue to struggle most to afford food
- Mississippi residents most likely to report struggling
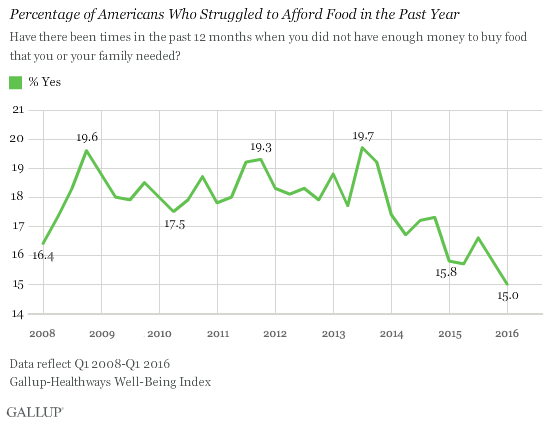
WASHINGTON, D.C. -- Fifteen percent of U.S. adults reported in the first quarter of 2016 that there have been times in the past 12 months when they did not have enough money to buy food that they or their family needed. This is the lowest percentage of Americans experiencing food hardship in any quarter since Gallup and Healthways began tracking this measure in 2008.

These findings are based on daily interviews conducted from January 2008 through March 2016 as part of the Gallup-Healthways Well-Being Index.
As fewer Americans report that they struggled to afford food, the April unemployment and underemployment rates as measured by Gallup reached their lowest levels since Gallup began tracking them in 2010. Previous Gallup and Healthways research has shown that those who are unemployed or are working part time but wanting full-time work are nearly three times as likely to lack enough money to afford food as those who are employed full time.
Along with the decline in the jobless rate, Americans' optimism about their personal financial situation is the highest it has been since 2007, and the percentage thriving in their financial well-being is up from the first quarter of 2014, when Gallup and Healthways began tracking it.
Despite these improvements, food hardship could still increase in the coming months. The Center on Budget and Policy Priorities predicts that between 500,000 and 1 million Americans will lose Supplemental Nutrition Assistance Program (SNAP) benefits, formerly known as food stamps, as 22 states re-establish three-month time limits and work requirements.
Blacks, Hispanics Continue to Struggle Most to Afford Food
Across key demographic groups, the percentage struggling to afford food declined somewhat over the past two years. Young adults aged 18-29 saw the most improvement across age groups, while blacks saw the most improvement across racial and ethnic groups. Still, blacks remain the most likely racial group to not have enough money to buy food. Blacks and Hispanics are roughly twice as likely as whites and more than three times as likely as Asians to say they have struggled to afford food at least once in the past year.
| Q1 2014 | Q1 2016 | Difference | |||||||||||||||||||||||||||||||||||||||||||||||||||||||||||||||||||||||||||||||||||||||||||||||||
|---|---|---|---|---|---|---|---|---|---|---|---|---|---|---|---|---|---|---|---|---|---|---|---|---|---|---|---|---|---|---|---|---|---|---|---|---|---|---|---|---|---|---|---|---|---|---|---|---|---|---|---|---|---|---|---|---|---|---|---|---|---|---|---|---|---|---|---|---|---|---|---|---|---|---|---|---|---|---|---|---|---|---|---|---|---|---|---|---|---|---|---|---|---|---|---|---|---|---|---|
| % | % | pct. pts. | |||||||||||||||||||||||||||||||||||||||||||||||||||||||||||||||||||||||||||||||||||||||||||||||||
| Age | |||||||||||||||||||||||||||||||||||||||||||||||||||||||||||||||||||||||||||||||||||||||||||||||||||
| 18 to 29 | 20.3 | 17.0 | -3.3 | ||||||||||||||||||||||||||||||||||||||||||||||||||||||||||||||||||||||||||||||||||||||||||||||||
| 30 to 44 | 20.6 | 17.8 | -2.8 | ||||||||||||||||||||||||||||||||||||||||||||||||||||||||||||||||||||||||||||||||||||||||||||||||
| 45 to 64 | 18.6 | 15.9 | -2.7 | ||||||||||||||||||||||||||||||||||||||||||||||||||||||||||||||||||||||||||||||||||||||||||||||||
| 65+ | 8.3 | 7.9 | -0.4 | ||||||||||||||||||||||||||||||||||||||||||||||||||||||||||||||||||||||||||||||||||||||||||||||||
| Race/Ethnicity | |||||||||||||||||||||||||||||||||||||||||||||||||||||||||||||||||||||||||||||||||||||||||||||||||||
| Black | 30.5 | 24.9 | -5.6 | ||||||||||||||||||||||||||||||||||||||||||||||||||||||||||||||||||||||||||||||||||||||||||||||||
| Hispanic | 25.2 | 22.4 | -2.6 | ||||||||||||||||||||||||||||||||||||||||||||||||||||||||||||||||||||||||||||||||||||||||||||||||
| White | 13.3 | 11.4 | -1.9 | ||||||||||||||||||||||||||||||||||||||||||||||||||||||||||||||||||||||||||||||||||||||||||||||||
| Asian | 9.5 | 7.2 | -2.3 | ||||||||||||||||||||||||||||||||||||||||||||||||||||||||||||||||||||||||||||||||||||||||||||||||
| Gallup-Healthways Well-Being Index | |||||||||||||||||||||||||||||||||||||||||||||||||||||||||||||||||||||||||||||||||||||||||||||||||||
Mississippi Residents Struggle Most, While North Dakota Residents Struggle Least
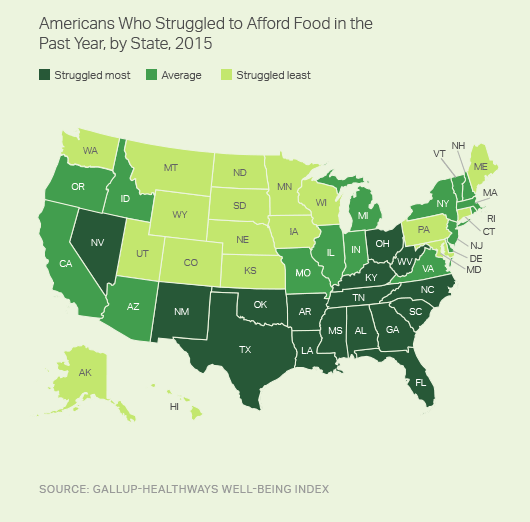
Along with these national findings from the first quarter of 2016, an aggregate of 2015 Gallup-Healthways data found Mississippi residents were most likely to struggle to afford food for the third consecutive year, followed by those living in Louisiana, Alabama, Oklahoma and West Virginia. Four of the five states with residents who were most likely to not have enough money to afford food were also among the states with the lowest overall well-being scores in 2015.
On the opposite end of the spectrum, North Dakota residents were least likely to struggle to afford food, which has been the case in all but one year since Gallup and Healthways began tracking this measure in 2008. All five states with residents who were least likely to struggle to afford food were also among the 2015 best-performing states in overall well-being.
| Yes | |||||||||||||||||||||||||||||||||||||||||||||||||||||||||||||||||||||||||||||||||||||||||||||||||||
|---|---|---|---|---|---|---|---|---|---|---|---|---|---|---|---|---|---|---|---|---|---|---|---|---|---|---|---|---|---|---|---|---|---|---|---|---|---|---|---|---|---|---|---|---|---|---|---|---|---|---|---|---|---|---|---|---|---|---|---|---|---|---|---|---|---|---|---|---|---|---|---|---|---|---|---|---|---|---|---|---|---|---|---|---|---|---|---|---|---|---|---|---|---|---|---|---|---|---|---|
| % | |||||||||||||||||||||||||||||||||||||||||||||||||||||||||||||||||||||||||||||||||||||||||||||||||||
| Most Likely | |||||||||||||||||||||||||||||||||||||||||||||||||||||||||||||||||||||||||||||||||||||||||||||||||||
| Mississippi | 22.9 | ||||||||||||||||||||||||||||||||||||||||||||||||||||||||||||||||||||||||||||||||||||||||||||||||||
| Louisiana | 21.4 | ||||||||||||||||||||||||||||||||||||||||||||||||||||||||||||||||||||||||||||||||||||||||||||||||||
| Alabama | 20.0 | ||||||||||||||||||||||||||||||||||||||||||||||||||||||||||||||||||||||||||||||||||||||||||||||||||
| Oklahoma | 19.5 | ||||||||||||||||||||||||||||||||||||||||||||||||||||||||||||||||||||||||||||||||||||||||||||||||||
| West Virginia | 19.3 | ||||||||||||||||||||||||||||||||||||||||||||||||||||||||||||||||||||||||||||||||||||||||||||||||||
| Least Likely | |||||||||||||||||||||||||||||||||||||||||||||||||||||||||||||||||||||||||||||||||||||||||||||||||||
| North Dakota | 8.4 | ||||||||||||||||||||||||||||||||||||||||||||||||||||||||||||||||||||||||||||||||||||||||||||||||||
| Hawaii | 10.2 | ||||||||||||||||||||||||||||||||||||||||||||||||||||||||||||||||||||||||||||||||||||||||||||||||||
| Minnesota | 10.7 | ||||||||||||||||||||||||||||||||||||||||||||||||||||||||||||||||||||||||||||||||||||||||||||||||||
| Alaska | 10.8 | ||||||||||||||||||||||||||||||||||||||||||||||||||||||||||||||||||||||||||||||||||||||||||||||||||
| Iowa | 11.0 | ||||||||||||||||||||||||||||||||||||||||||||||||||||||||||||||||||||||||||||||||||||||||||||||||||
| January-December 2015 | |||||||||||||||||||||||||||||||||||||||||||||||||||||||||||||||||||||||||||||||||||||||||||||||||||
| Gallup-Healthways Well-Being Index | |||||||||||||||||||||||||||||||||||||||||||||||||||||||||||||||||||||||||||||||||||||||||||||||||||
Similar to previous years, residents of Southern states are most likely to lack enough money to buy food, while residents of Midwest and Northern states are least likely.

Bottom Line
Even though fewer Americans overall report not having enough money for food, wide disparities exist across regions and among racial and ethnic groups. Nearly all Southern states are above the national average in their percentage of residents who struggle to afford food. Additionally, blacks and Hispanics remain about twice as likely as whites to struggle to afford food.
Although there is strong evidence that the SNAP program helps alleviate food hardship, the significant drop in the percentage struggling to afford food cannot be attributed to increased dependency on SNAP. SNAP participation in February 2016 reached its lowest level in five years, according to the Food Research and Action Center.
Survey Methods
Results are based on telephone interviews conducted Jan. 1-March 31, 2016, as part of the Gallup-Healthways Well-Being Index survey, with a random sample of 44,558 adults, aged 18 and older, living in all 50 U.S. states and the District of Columbia. For results based on the total sample of national adults, the margin of sampling error is ±0.6 percentage points at the 95% confidence level.
For age and race, all reported margins of sampling error are at the 95% confidence interval.
| Age | |||||||||||||||||||||||||||||||||||||||||||||||||||||||||||||||||||||||||||||||||||||||||||||||||||
|---|---|---|---|---|---|---|---|---|---|---|---|---|---|---|---|---|---|---|---|---|---|---|---|---|---|---|---|---|---|---|---|---|---|---|---|---|---|---|---|---|---|---|---|---|---|---|---|---|---|---|---|---|---|---|---|---|---|---|---|---|---|---|---|---|---|---|---|---|---|---|---|---|---|---|---|---|---|---|---|---|---|---|---|---|---|---|---|---|---|---|---|---|---|---|---|---|---|---|---|
| 18-29 | +/- 1.38 | ||||||||||||||||||||||||||||||||||||||||||||||||||||||||||||||||||||||||||||||||||||||||||||||||||
| 30-44 | +/- 1.24 | ||||||||||||||||||||||||||||||||||||||||||||||||||||||||||||||||||||||||||||||||||||||||||||||||||
| 45-64 | +/- 0.93 | ||||||||||||||||||||||||||||||||||||||||||||||||||||||||||||||||||||||||||||||||||||||||||||||||||
| 65+ | +/- 1.01 | ||||||||||||||||||||||||||||||||||||||||||||||||||||||||||||||||||||||||||||||||||||||||||||||||||
| Race | |||||||||||||||||||||||||||||||||||||||||||||||||||||||||||||||||||||||||||||||||||||||||||||||||||
| White | +/- 0.65 | ||||||||||||||||||||||||||||||||||||||||||||||||||||||||||||||||||||||||||||||||||||||||||||||||||
| Black | +/- 1.8 | ||||||||||||||||||||||||||||||||||||||||||||||||||||||||||||||||||||||||||||||||||||||||||||||||||
| Asian | +/- 3.56 | ||||||||||||||||||||||||||||||||||||||||||||||||||||||||||||||||||||||||||||||||||||||||||||||||||
| Hispanic | +/- 1.68 | ||||||||||||||||||||||||||||||||||||||||||||||||||||||||||||||||||||||||||||||||||||||||||||||||||
| Gallup-Healthways Well-Being Index | |||||||||||||||||||||||||||||||||||||||||||||||||||||||||||||||||||||||||||||||||||||||||||||||||||
All reported margins of sampling error include computed design effects for weighting.
State results are based on telephone interviews conducted Jan. 2-Dec. 30, 2015, as a part of the Gallup-Healthways Well-Being Index, with a random sample of 177,281 adults, aged 18 and older, living in all 50 U.S. states and the District of Columbia. For results based on the total sample of national adults, the margin of sampling error for the Well-Being Index score is ±0.1 point at the 95% confidence level. The margin of sampling error for most states is about ±0.6 points, although this increases to about ±1.6 points for the smallest population states such as North Dakota, Wyoming, Hawaii and Delaware. All reported margins of sampling error include computed design effects for weighting.
For data collected prior to Sept. 1, 2015, each sample of national adults includes a minimum quota of 50% cellphone respondents and 50% landline respondents. For data collected between Sept. 1, 2015, and Mar. 31, 2016, each sample of national adults includes a minimum quota of 60% cellphone respondents and 40% landline respondents. Additional minimum quotas by time zone within region are included in the sampling approach.


