Story Highlights
- 44% say employer is hiring workers and expanding workforce
- 11% say employer is letting workers go, reducing workforce
- +33 Job Creation Index score highest to date, by one point
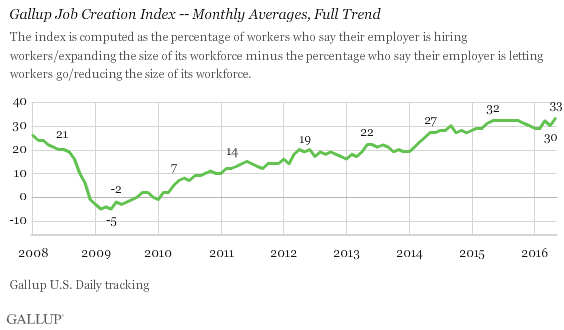
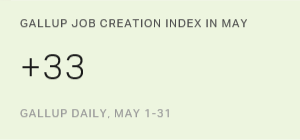
PRINCETON, N.J. -- U.S. workers' reports of hiring activity at their place of employment are the most positive in Gallup's eight-year trend. Forty-four percent of workers in May said their employer is hiring workers and expanding the size of its workforce, while 11% said their employer is letting workers go and cutting the number of jobs. The resulting +33 Job Creation Index score is the highest monthly average to date, by one point.

The Job Creation Index improved three points in May from April's +30. Gallup has observed at least a slight improvement in the index between April and May each year since 2013, and in most years since 2008. These regular April-to-May increases suggest employers ramp up their hiring when the summer months approach. The April-to-May increase in 2015 boosted the index to its previous high of +32, a level it sustained through October.
From December 2008 through August 2009, during and immediately after the economic recession, more workers consistently reported a net loss of jobs where they worked rather than a net gain. By October 2010, the hiring outlook had brightened and the index reached +10 for the first time since the recession. The index hit +20 in April 2012, and +30 in September 2014.
The latest Job Creation Index is based on interviews with 18,604 U.S. adults who are employed full or part time, conducted throughout the month of May. In addition to the 44% of workers reporting a net hiring increase and the 11% reporting a net hiring decrease, 39% of workers say the size of their workforce is unchanged.

Hiring Improving in East
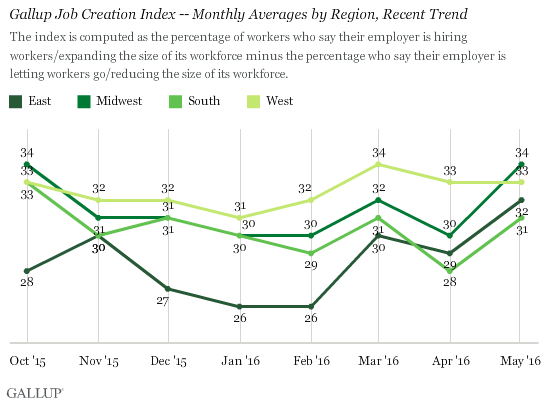
Since 2009, workers in the Eastern U.S. have tended to report a less positive hiring situation where they work compared with workers in other parts of the country. Heavy job losses in the financial services industry after the Great Recession may be one reason why. But May's +32 Job Creation Index score among workers in the East marks the first time in Gallup's trend that the index has exceeded +30 in this region of the U.S.
That improvement puts the East on roughly equal footing with workers in the Midwest (+34), South (+31) and West (+33). In recent months, workers in the West have tended to report the most positive hiring situation.

Implications
U.S. workers have been reporting a healthy hiring situation at their places of employment for quite some time, but in May, they were the most positive they have been in the past eight years. Part of the improvement in worker hiring reports since April may reflect normal seasonal increases in hiring on top of an already active hiring market.
The new Gallup data are encouraging after the U.S. Bureau of Labor Statistics reported that a disappointing 160,000 jobs were added to the U.S. economy in April -- far below analysts' predictions. That figure made some economists fear a slowdown in hiring may be occurring. Later this week, the BLS will release its May employment report.
A pullback in hiring would not have been unexpected after the U.S. economy grew at a weak rate in the first quarter. However, both Gallup and the Department of Commerce reported a strong rebound in consumer spending in April. Consumer spending is the major driver of the U.S. economy, and greater economic activity in the spring months may have calmed employers' fears about adding to their payrolls.
These data are available in Gallup Analytics.
Survey Methods
Results for this Gallup poll are based on telephone interviews conducted May 1-31, 2016, on the Gallup U.S. Daily survey, with a random sample of 18,604 adults, aged 18 and older, living in all 50 U.S. states and the District of Columbia, who are employed full or part time. For results based on the total sample of working adults, the margin of sampling error is ±1 percentage point at the 95% confidence level. All reported margins of sampling error include computed design effects for weighting.
Each sample of national adults includes a minimum quota of 60% cellphone respondents and 40% landline respondents, with additional minimum quotas by time zone within region. Landline and cellular telephone numbers are selected using random-digit-dial methods.
Learn more about how the Gallup U.S. Daily works.


