Story Highlights
- Daily spending reports averaged $100 in July
- July's average $12 higher than the prior month
- Highest average for any month since July 2008
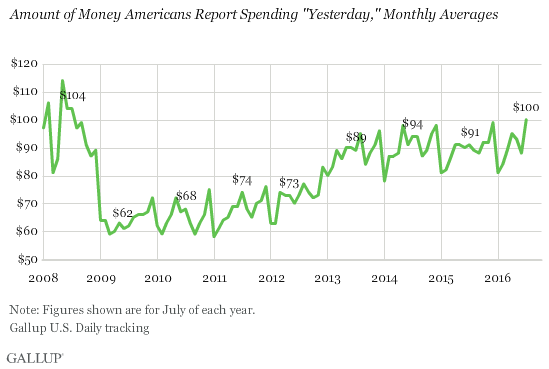
WASHINGTON, D.C. -- Americans' daily self-reports of spending averaged $100 in July, a $12 increase from June. Gallup's measure of consumer spending has not been at this level since July 2008, though it reached $99 in December.

These results are based on Gallup Daily tracking interviews conducted throughout July. Gallup asks Americans each night to report how much they spent "yesterday," excluding normal household bills and major purchases such as a home or car. The measure gives an indication of discretionary spending.
After dropping dramatically in 2008 and early 2009 amid the global financial crisis, Americans' reported spending levels gradually held at low levels -- mostly in the $60 to $70 range -- through late 2012. At that point, they began to increase and have typically been in the $80 to $90 range since. Spending estimates have reached the $100 average only a few times in Gallup's trend prior to July, all before the financial crisis took hold in 2008.
July typically ranks among the highest spending months in Gallup's nearly nine-year trend. However, large increases between June and July, such as those this year, are not common. The average June-to-July increase had been $2 before this year.
Spending Up Among All Income Groups
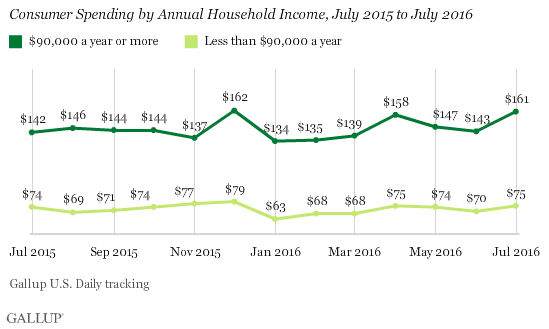
Spending among Americans with annual household incomes of less than $90,000 increased by $5 from June's average, erasing the decline observed among this group from May to June. The current monthly figure for lower- and middle-income Americans is one of the highest in the past year.
Americans whose households earn $90,000 or more annually saw a much more significant increase -- $18 -- from June to July. The latest monthly spending average for this income group, $161, essentially matches the $162 from December, when the spending average among all Americans was $99.

Bottom Line
The latest spending average is a notable marker in the post-recession spending trend, as monthly averages have not reached or exceeded $100 since 2008.
While spending was slightly depressed in June, this could have been because Americans anticipated spending more in July. Gallup observed a notable pullback in spending in the second half of June compared with the first. In addition to robust spending during the July Fourth holiday, the month had five weekends as opposed to four. Since Americans spend proportionately more on weekends than weekdays, according to Gallup data, this helped keep the spending at a higher level for the month of July.
These data are available in Gallup Analytics.
Survey Methods
Results for this Gallup poll are based on telephone interviews conducted July 1-31, 2016, on the Gallup U.S. Daily survey, with a random sample of 14,181 adults, aged 18 and older, living in all 50 U.S. states and the District of Columbia. For results based on the total sample of national adults, the margin of error for the spending mean is ±$5 at the 95% confidence level. All reported margins of sampling error include computed design effects for weighting.
Each sample of national adults includes a minimum quota of 60% cellphone respondents and 40% landline respondents, with additional minimum quotas by time zone within region. Landline and cellular telephone numbers are selected using random-digit-dial methods.
Learn more about how the Gallup U.S. Daily works.


