Story Highlights
- Weekly average for week ending March 5 stood at +16
- Current conditions component score at record monthly high
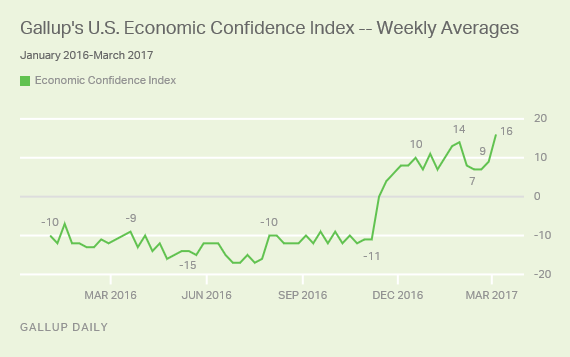
WASHINGTON, D.C. -- Many Americans either gained or regained economic optimism last week, as Gallup's U.S. Economic Confidence Index soared seven points to hit +16. This marks the highest weekly average in Gallup's nine-year trend. The index has recovered the ground it lost over the week of Jan. 30-Feb. 5, when it fell from the previous record high of +14 to +8 and languished at that lower level for the next three weeks.

Gallup's U.S. Economic Confidence Index is the average of two components: how Americans rate current economic conditions and whether they feel the economy is improving or getting worse. The index has a theoretical maximum of +100 if all Americans were to say the economy is doing well and improving, and a theoretical minimum of -100 if all Americans were to say the economy is doing poorly and getting worse.
Last week was an eventful one for the U.S. economy. President Donald Trump gave his maiden address to Congress on Feb. 28, emphasizing his key economic policy goals such as lowering the corporate tax rate. Those who watched the speech were generally pleased with it, and traders on Wall Street were decidedly upbeat: Stock markets rallied on Wednesday, and the Dow Jones industrial average closed above 21,000 for the first time in its history. Federal Reserve Board Chair Janet Yellen also spoke favorably of current economic conditions in a speech on Friday.
It is impossible to know which of these events played the most important role in boosting Americans' confidence last week, though it seems unlikely that Yellen's remarks influenced the public much given her low name recognition. Trump, meanwhile, commanded a large national audience, and his speech likely helped spark the stock market's record-setting performance the next day.
Curiously, though, it was Democrats who showed the largest improvement in economic confidence from Wednesday to Sunday of last week, the period after Trump's speech and the stock market rally. Over the seven days leading up these two events (Feb. 22-28), Democrats registered an index score of -7; for the five-day period of March 1-5, their score rose to 0. Republicans, on the other hand, showed modest gains; their index score rose from +45 to +48 in the same time frame.
As Democrats, by and large, disapprove of Trump's job performance as president, this would seem to suggest that other factors, such as the stock market rally, may have helped shape economic attitudes last week.
Americans' Monthly Ratings of Current Economic Conditions at Record High
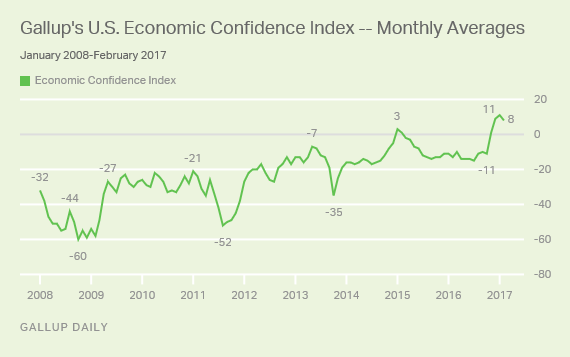
For the month of February, Gallup's U.S. Economic Confidence Index averaged +8, three points below January's record-setting score.

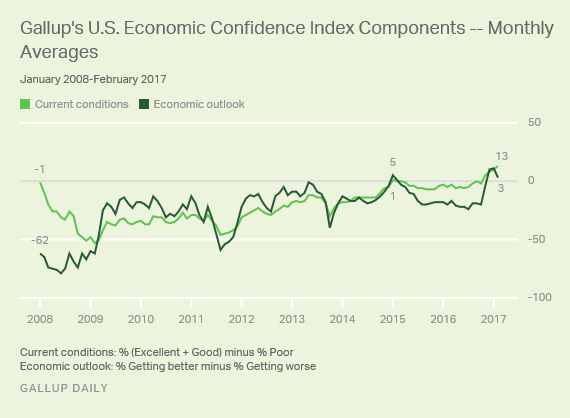
In February, one-third of U.S. adults (33%) described economic conditions as "excellent" or "good," while 20% rated them as "poor." This resulted in a current conditions score of +13 for the month -- a three-point increase from January's score and a nine-year high for this component.
Opinions about the future trajectory of the economy, however, soured last month. Less than half of U.S. adults (48%) said economic conditions were "getting better," while nearly as many (45%) said they were getting worse -- yielding a score of +3 for the economic outlook component. In January, the economic outlook component averaged +11.

Bottom Line
Though confidence in the economy appeared to stall in the month of February after rising steadily throughout the past three months, it may have gained a second wind last week after Trump's speech to Congress and the stock market's strong performance.
These data are available in Gallup Analytics.
Gallup.com reports results from these indexes in daily, weekly and monthly averages and in Gallup.com stories. Complete trend data are always available to view in the following charts:
Daily: Employment, Economic Confidence, Consumer Spending
Weekly: Employment, Economic Confidence, Job Creation, Consumer Spending
Read more about Gallup's economic measures.
View our economic release schedule.
Survey Methods
Results for this Gallup poll are based on telephone interviews conducted Feb. 27-March 5, 2017, on the Gallup U.S. Daily survey, with a random sample of 3,531 adults, aged 18 and older, living in all 50 U.S. states and the District of Columbia. For results based on the total sample of national adults, the margin of sampling error is ±2 percentage points at the 95% confidence level. All reported margins of sampling error include computed design effects for weighting.
Each sample of national adults includes a minimum quota of 70% cellphone respondents and 30% landline respondents, with additional minimum quotas by time zone within region. Landline and cellular telephone numbers are selected using random-digit-dial methods.
Learn more about how the Gallup U.S. Daily works.


