Story Highlights
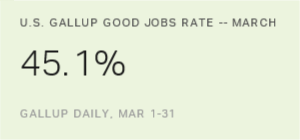
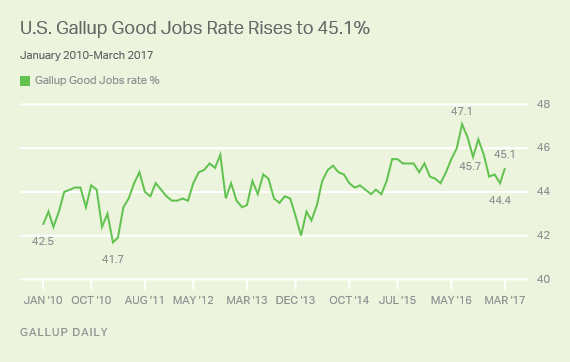
- GGJ up to 45.1% in March from 44.4% in February
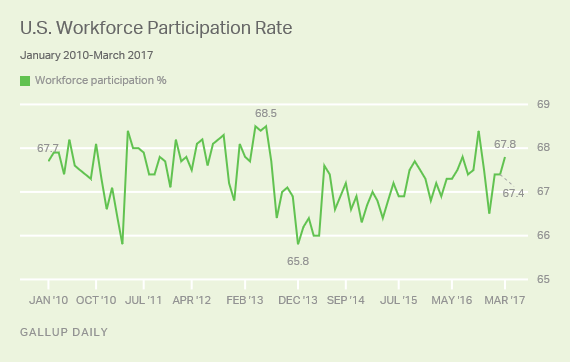
- Workforce participation up to 67.8% in March from 67.4% in February
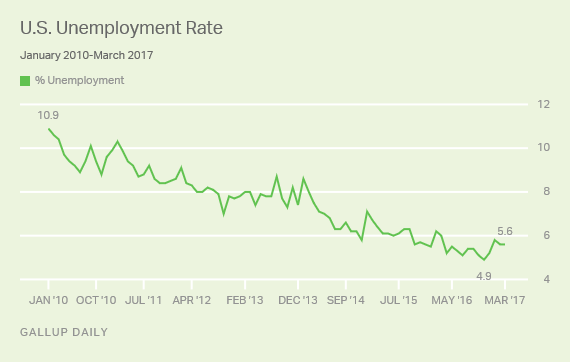
- Unemployment rate held steady at 5.6%
WASHINGTON, D.C. -- The Gallup Good Jobs rate rose to 45.1% in March from 44.4% in February. Although down from its peak of 47.1% in July of 2016, it is currently higher than the 44.4% recorded in March of 2016. The GGJ is at its highest point since November 2016 (45.7%).
These data are based on interviews with 31,398 U.S. adults, conducted from March 1-31 as part of Gallup Daily tracking.
The GGJ is the percentage of U.S. adults, over the age of 18 who were employed on a full-time basis, at least 30 hours a week. Not included in the measure are individuals who are self-employed, work fewer than 30 hours a week, are unemployed or are out of the workforce. The GGJ metric only reflects those who are employed on a full-time basis for an employer and does not include measures of job satisfaction or compensation. GGJ is not seasonally adjusted.
Gallup began measuring the GGJ rate in January 2010 and since then, it has generally trended upward over time. The average month-over-month rate of change for the GGJ has been +0.3 percentage points, since January 2011, the first month for which data could be compared with data recorded in the same month of the previous year. The rate of change from March 2016 to March of this year was more than twice the average at +0.7 percentage points.
Workforce Participation Up to 67.8% in March
U.S. workforce participation increased slightly to 67.8% in March from 67.4% in February. Gallup's measure of workforce participation includes all those U.S. adults who participated in the workforce in any capacity, including those who worked full time or part time as well as those who were not working but actively sought and were available for work. The current rate of workforce participation is nearly a full percentage point higher than it was in March 2016 (66.9%).
Unemployment Holds Steady at 5.6%
Gallup's unemployment rate in the U.S. was unchanged in March at 5.6%. However, this is still down slightly from 6.0% in March of 2016. The Gallup unemployment rate is a measure of the percentage of U.S. adults who have not had any paid employment in the past seven days and were actively looking for and available for work.
Rather than being measures of the total population like the GGJ rate, both the Gallup and U.S. Bureau of Labor Statistics (BLS) unemployment rates are percentages of the labor force, defined as those who are working or seeking work. While the Gallup and BLS measures are similar, there are methodological differences between the two. These differences are outlined at the end of this article.
Perhaps the most significant difference is that the BLS seasonally adjusts its most commonly used measure of unemployment, while Gallup does not. Gallup's measure has a strong correlation to those released by the BLS. However, the two measures do not always match on a monthly basis.
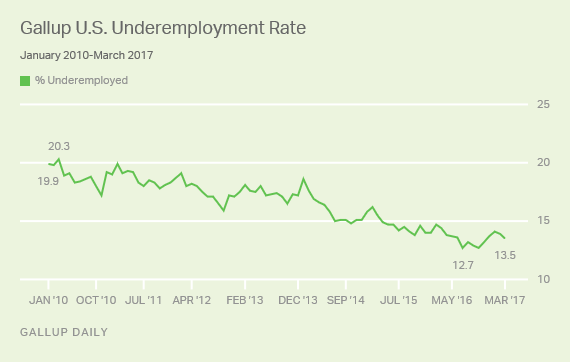
Underemployment Decreases to 13.5%
Gallup's measure of underemployment decreased from 13.9% in January to 13.5% in March. Underemployment was also down from 14.4% in March of 2016 and below the average (16.6%) since Gallup began tracking the measure in January 2010. Gallup's measure of underemployment is a combination of those U.S. adults who are unemployed (5.6%) and those who are working part time, but would like full-time work (7.9%).
Bottom Line
Three out of four of Gallup's economic metrics -- the GGJ metric, the workforce participation rate and the underemployment rate showed at least slight improvement since the beginning of the year. In addition to Gallup's data, the BLS reports an estimated 235,000 new jobs were added to the U.S. economy in February alone and jobless claims are near a 44-year low. The stock market, despite its recent dip, remains at near-record highs. Taken together, Gallup's measures and the other indicators point to a strengthening economy.
There is additional reason for optimism, as the Gallup Good Jobs rate is typically lowest in the first few months of the year. Employment typically improves in the spring, with a +0.6-percentage-point increase, on average, in the Gallup Good Jobs rate from March to April.
These data are available in Gallup Analytics.
Gallup.com reports results from these indexes in daily, weekly, and monthly averages and in Gallup.com stories. Complete trend data are always available to view in the following charts:
Daily: Employment, Economic Confidence, Job Creation, Consumer Spending
Weekly: Employment, Economic Confidence, Job Creation, Consumer Spending
Read more about Gallup's economic measures.
View our economic release schedule.
| Most recent month (Mar 2017) | Previous month (Feb 2017) | Month a year ago (Mar 2016) | |||||||||||||||||||||||||||||||||||||||||||||||||||||||||||||||||||||||||||||||||||||||||||||||||
|---|---|---|---|---|---|---|---|---|---|---|---|---|---|---|---|---|---|---|---|---|---|---|---|---|---|---|---|---|---|---|---|---|---|---|---|---|---|---|---|---|---|---|---|---|---|---|---|---|---|---|---|---|---|---|---|---|---|---|---|---|---|---|---|---|---|---|---|---|---|---|---|---|---|---|---|---|---|---|---|---|---|---|---|---|---|---|---|---|---|---|---|---|---|---|---|---|---|---|---|
| % | % | % | |||||||||||||||||||||||||||||||||||||||||||||||||||||||||||||||||||||||||||||||||||||||||||||||||
| Employed full time for an employer (GGJ)* | 45.1 | 44.4 | 44.4 | ||||||||||||||||||||||||||||||||||||||||||||||||||||||||||||||||||||||||||||||||||||||||||||||||
| Employed full time for self* | 6.0 | 6.4 | 5.6 | ||||||||||||||||||||||||||||||||||||||||||||||||||||||||||||||||||||||||||||||||||||||||||||||||
| Workforce participation rate* | 67.8 | 67.4 | 66.9 | ||||||||||||||||||||||||||||||||||||||||||||||||||||||||||||||||||||||||||||||||||||||||||||||||
| Unemployment rate** | 5.6 | 5.6 | 6.0 | ||||||||||||||||||||||||||||||||||||||||||||||||||||||||||||||||||||||||||||||||||||||||||||||||
| Employed part time, wanting full time** | 7.9 | 8.2 | 8.5 | ||||||||||||||||||||||||||||||||||||||||||||||||||||||||||||||||||||||||||||||||||||||||||||||||
| Underemployment rate** | 13.5 | 13.9 | 14.4 | ||||||||||||||||||||||||||||||||||||||||||||||||||||||||||||||||||||||||||||||||||||||||||||||||
| *Metrics represent percentages of the population aged 18+ who have a job or are actively seeking work. **Metrics represent percentages of the workforce. | |||||||||||||||||||||||||||||||||||||||||||||||||||||||||||||||||||||||||||||||||||||||||||||||||||
| Gallup Daily | |||||||||||||||||||||||||||||||||||||||||||||||||||||||||||||||||||||||||||||||||||||||||||||||||||
| Gallup | U.S. Bureau of Labor Statistics | ||||||||||||||||||||||||||||||||||||||||||||||||||||||||||||||||||||||||||||||||||||||||||||||||||
|---|---|---|---|---|---|---|---|---|---|---|---|---|---|---|---|---|---|---|---|---|---|---|---|---|---|---|---|---|---|---|---|---|---|---|---|---|---|---|---|---|---|---|---|---|---|---|---|---|---|---|---|---|---|---|---|---|---|---|---|---|---|---|---|---|---|---|---|---|---|---|---|---|---|---|---|---|---|---|---|---|---|---|---|---|---|---|---|---|---|---|---|---|---|---|---|---|---|---|---|
| Population | 18 and older | 16 and older | |||||||||||||||||||||||||||||||||||||||||||||||||||||||||||||||||||||||||||||||||||||||||||||||||
| Adjustments | Not seasonally adjusted | Seasonally adjusted | |||||||||||||||||||||||||||||||||||||||||||||||||||||||||||||||||||||||||||||||||||||||||||||||||
| Sample size | 30,000 individuals per month | 60,000 households per month | |||||||||||||||||||||||||||||||||||||||||||||||||||||||||||||||||||||||||||||||||||||||||||||||||
| Mode of interview | RDD telephone, including cellphones | Rotating panel with face-to-face and telephone interviewing | |||||||||||||||||||||||||||||||||||||||||||||||||||||||||||||||||||||||||||||||||||||||||||||||||
| Data collection period | Continuous | One-week reference period occurring mid-month | |||||||||||||||||||||||||||||||||||||||||||||||||||||||||||||||||||||||||||||||||||||||||||||||||
| Reporting frequency | Daily, weekly, monthly, based on 30-day rolling averages | Monthly, based on one-week reference period | |||||||||||||||||||||||||||||||||||||||||||||||||||||||||||||||||||||||||||||||||||||||||||||||||
| Gallup | |||||||||||||||||||||||||||||||||||||||||||||||||||||||||||||||||||||||||||||||||||||||||||||||||||
Survey Methods
Results for this Gallup poll are based on telephone interviews conducted March 1-31, 2017, on the Gallup U.S. Daily survey, with a random sample of 31,398 adults, aged 18 and older, living in all 50 U.S. states and the District of Columbia. For results based on the total sample of national adults, the margin of sampling error is ±1 percentage point at the 95% confidence level. All reported margins of sampling error include computed design effects for weighting.
Each sample of national adults includes a minimum quota of 70% cellphone respondents and 30% landline respondents, with additional minimum quotas by time zone within region. Landline and cellular telephone numbers are selected using random-digit-dial methods.
Learn more about how the Gallup U.S. Daily works.