Story Highlights
- 56% viewed job market positively in 2017, up from 42% in 2016
- Confidence in job market buoyed by Republicans since Trump's inauguration
- 40% of unemployed adults seeking jobs rated job market as good
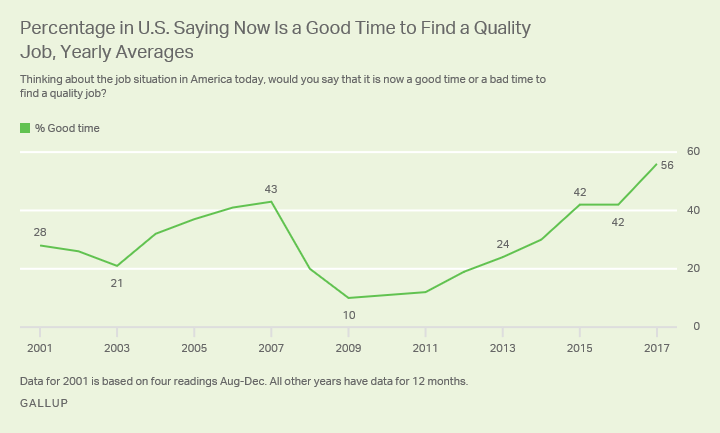
WASHINGTON, D.C. -- Americans' optimism about finding a quality job averaged 56% in 2017, the highest annual average in 17 years of Gallup polling and a sharp increase from 42% in 2016. Coinciding with rising optimism, the U.S. unemployment rate fell from an average 4.9% in 2016 to 4.4% in 2017, the lowest rate since 2000.

Since October 2001, Gallup has asked Americans monthly if it is a good time or a bad time to find a quality job. Historically, Americans' perceptions of the job market have tracked closely with the monthly unemployment figures from the U.S. Bureau of Labor Statistics. When the unemployment rate is low, public perceptions that it is a good time to find a quality job rise. Conversely, when the unemployment rate is high, views of the job market get worse.
Prior to this year, Americans' assessments of the job market were most positive in 2007 (43%) at the start of the Great Recession and least positive its last year, 2009 (10%). Since the job market bottomed out in 2009, Americans' ratings of it have improved steadily, rising to the highest level yet in 2017.
Sharp Republican Reversal on Job Market in 2017
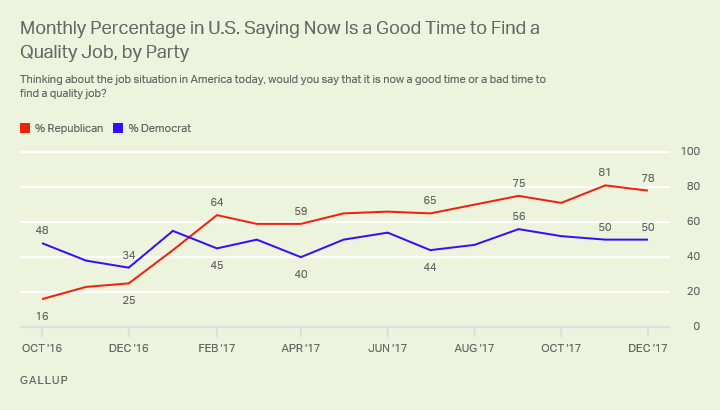
Positivity about jobs among all U.S. adults began to rise on a monthly basis in January 2017, reaching 54% in February 2017. By the end of 2017, it hit 62% in November and again in December. This increase was largely driven by a Republican reversal. The monthly reading for Republicans saying it was a good time to find a quality job rose 20 percentage points to 64% after Donald Trump was inaugurated and ultimately ended 2017 at 78%.

Partisans who identify with the sitting president's party typically hold more favorable views than those of the opposing party concerning the economy and other national metrics. While the shift in Republicans' view of the job market was dramatic after Trump's election and inauguration, the change in Democrats' opinion of the job market following Barack Obama's exit from the White House was more modest. This was perhaps because the general consensus at the time was that the economy and job market were in poor shape. Shortly after Trump took office, the percentage of Democrats who said it was a good time to find a quality job fell 10 points to 45%, and was 50% last month.
Demographic Differences in Assessments of Job Market
Several demographic groups were less inclined than others to think 2017 was a good time to find a job, including those who were out of work and trying to find a job, blacks and those in households earning less than $30,000 a year. These are typically Democratic groups and less than half of each of them assessed the job market positively in 2017.
Those employed full time, college graduates and those with annual household incomes of $75,000 or more are among the demographic groups that are most likely to say it is a good time to find a quality job. The assessments of the job market by each of these groups improved by double digits from 2016 to 2017. Additionally, the greatest increase in perception on this issue is among whites (21 points), respondents 50 and older (20 points) and men (18 points), all typically Republican groups.
| Good time in 2016 | Good time in 2017 | |||||||||||||||||||||||||||||||||||||||||||||||||||||||||||||||||||||||||||||||||||||||||||||||||||
|---|---|---|---|---|---|---|---|---|---|---|---|---|---|---|---|---|---|---|---|---|---|---|---|---|---|---|---|---|---|---|---|---|---|---|---|---|---|---|---|---|---|---|---|---|---|---|---|---|---|---|---|---|---|---|---|---|---|---|---|---|---|---|---|---|---|---|---|---|---|---|---|---|---|---|---|---|---|---|---|---|---|---|---|---|---|---|---|---|---|---|---|---|---|---|---|---|---|---|---|---|
| % | % | |||||||||||||||||||||||||||||||||||||||||||||||||||||||||||||||||||||||||||||||||||||||||||||||||||
| Gender | ||||||||||||||||||||||||||||||||||||||||||||||||||||||||||||||||||||||||||||||||||||||||||||||||||||
| Men | 44 | 62 | ||||||||||||||||||||||||||||||||||||||||||||||||||||||||||||||||||||||||||||||||||||||||||||||||||
| Women | 41 | 51 | ||||||||||||||||||||||||||||||||||||||||||||||||||||||||||||||||||||||||||||||||||||||||||||||||||
| Party ID | ||||||||||||||||||||||||||||||||||||||||||||||||||||||||||||||||||||||||||||||||||||||||||||||||||||
| Republican | 31 | 66 | ||||||||||||||||||||||||||||||||||||||||||||||||||||||||||||||||||||||||||||||||||||||||||||||||||
| Independent | 41 | 55 | ||||||||||||||||||||||||||||||||||||||||||||||||||||||||||||||||||||||||||||||||||||||||||||||||||
| Democrat | 53 | 49 | ||||||||||||||||||||||||||||||||||||||||||||||||||||||||||||||||||||||||||||||||||||||||||||||||||
| Age | ||||||||||||||||||||||||||||||||||||||||||||||||||||||||||||||||||||||||||||||||||||||||||||||||||||
| 18-29 | 55 | 58 | ||||||||||||||||||||||||||||||||||||||||||||||||||||||||||||||||||||||||||||||||||||||||||||||||||
| 30-49 | 46 | 59 | ||||||||||||||||||||||||||||||||||||||||||||||||||||||||||||||||||||||||||||||||||||||||||||||||||
| 50-64 | 37 | 57 | ||||||||||||||||||||||||||||||||||||||||||||||||||||||||||||||||||||||||||||||||||||||||||||||||||
| 65+ | 30 | 50 | ||||||||||||||||||||||||||||||||||||||||||||||||||||||||||||||||||||||||||||||||||||||||||||||||||
| Annual household income | ||||||||||||||||||||||||||||||||||||||||||||||||||||||||||||||||||||||||||||||||||||||||||||||||||||
| Less than $30,000 annual income | 38 | 46 | ||||||||||||||||||||||||||||||||||||||||||||||||||||||||||||||||||||||||||||||||||||||||||||||||||
| $30,000-less than $75,000 | 42 | 54 | ||||||||||||||||||||||||||||||||||||||||||||||||||||||||||||||||||||||||||||||||||||||||||||||||||
| $75,000 or more | 48 | 66 | ||||||||||||||||||||||||||||||||||||||||||||||||||||||||||||||||||||||||||||||||||||||||||||||||||
| Race/Ethnicity | ||||||||||||||||||||||||||||||||||||||||||||||||||||||||||||||||||||||||||||||||||||||||||||||||||||
| White | 38 | 59 | ||||||||||||||||||||||||||||||||||||||||||||||||||||||||||||||||||||||||||||||||||||||||||||||||||
| Black | 55 | 48 | ||||||||||||||||||||||||||||||||||||||||||||||||||||||||||||||||||||||||||||||||||||||||||||||||||
| Hispanic | 49 | 53 | ||||||||||||||||||||||||||||||||||||||||||||||||||||||||||||||||||||||||||||||||||||||||||||||||||
| Education | ||||||||||||||||||||||||||||||||||||||||||||||||||||||||||||||||||||||||||||||||||||||||||||||||||||
| College graduate | 48 | 61 | ||||||||||||||||||||||||||||||||||||||||||||||||||||||||||||||||||||||||||||||||||||||||||||||||||
| Not a college graduate | 39 | 54 | ||||||||||||||||||||||||||||||||||||||||||||||||||||||||||||||||||||||||||||||||||||||||||||||||||
| Employment | ||||||||||||||||||||||||||||||||||||||||||||||||||||||||||||||||||||||||||||||||||||||||||||||||||||
| Employed full time | 50 | 62 | ||||||||||||||||||||||||||||||||||||||||||||||||||||||||||||||||||||||||||||||||||||||||||||||||||
| Employed part time | 38 | 53 | ||||||||||||||||||||||||||||||||||||||||||||||||||||||||||||||||||||||||||||||||||||||||||||||||||
| Unemployed but looking for work | 36 | 40 | ||||||||||||||||||||||||||||||||||||||||||||||||||||||||||||||||||||||||||||||||||||||||||||||||||
| GALLUP | ||||||||||||||||||||||||||||||||||||||||||||||||||||||||||||||||||||||||||||||||||||||||||||||||||||
Americans in the lowest household income bracket and those unemployed and searching for work are undoubtedly discouraged by their personal situations and therefore are less likely to see it as a good time to find a quality job, even though the unemployment rate is at its lowest point since 2000.
Likewise, black Americans, who experienced record unemployment in December, think the job market is worse than do whites and Hispanics. Yet, unlike those with annual household incomes under $30,000 and the unemployed who are looking for work, blacks and Democrats have grown significantly less positive about the availability of quality jobs since Trump became president. These were the only groups that in 2017 showed a decline in positive ratings compared to 2016.
Bottom Line
Gallup didn't start gauging the public's assessment of the job market with the quality jobs question until 2001; thus there are no data to compare against the last time the unemployment rate was as low as it is now. Republicans view the job market much better now than Democrats did during Obama's presidency. While this overwhelming positivity about the job market by Republicans can certainly be attributed partially to a lower unemployment rate, partisanship also plays a large part.
Survey Methods
Results for this Gallup poll are based on telephone interviews conducted throughout 2017 with a random sample of 13,185 adults, aged 18 and older, living in all 50 U.S. states and the District of Columbia. For results based on the total sample of national adults, the margin of sampling error is ±1 percentage points at the 95% confidence level. All reported margins of sampling error include computed design effects for weighting.
Each sample of national adults includes a minimum quota of 70% cellphone respondents and 30% landline respondents, with additional minimum quotas by time zone within region. Landline and cellular telephone numbers are selected using random-digit-dial methods.
Learn more about how the Gallup Poll Social Series works.


