Story Highlights
- 11% now fear layoffs, up slightly from last year's record-low 8%
- 59% say it's "not at all" likely they will be laid off
- Income makes major difference in confidence about job security
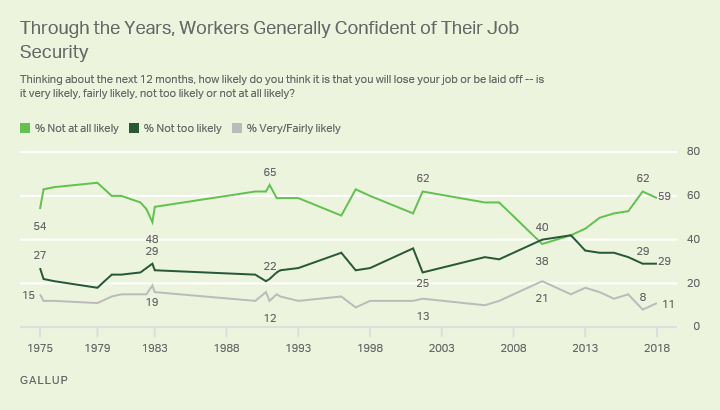
WASHINGTON, D.C. -- Eleven percent of American workers say they are "very" or "fairly" likely to be laid off in the next year, a slight increase from last year's record-low 8%. A solid majority of 59% express total confidence in their job security, saying it is "not at all" likely they will lose their job or be laid off in the next 12 months. Twenty-nine percent say it is "not too" likely.

Gallup has measured the likelihood of being laid off 31 times starting in 1975, and has asked the question every April since 2012. Over those past seven polls, the monthly U.S. unemployment rate has declined or stayed the same in March (the month before the survey) of all but one year -- shrinking by half overall, from 8.2% in 2012 to 4.1% last month. During the first six of those years, workers' confidence in the security of their jobs increased accordingly -- rising from 42% saying it was not at all likely they would be laid off in 2012 to 62% last year, before the dip to this year's 59%.
The current U.S. monthly unemployment rate of 4.1% is the lowest it has been since December 2000. Before December 1999, the rate had not been below 4.1% since January 1970.
The highest percentage of workers saying they were very or fairly likely to be laid off -- 21% -- occurred in April 2010, the first time the question was asked after the Great Recession of 2007-2009. That poll also registered the lowest percentage -- 38% -- saying they were not at all likely to lose their jobs. At that point, the unemployment rate was 9.9%.
With Job Growth Nationwide, Job Security Increases Across Subgroups
Workers' confidence that their jobs are secure has been through three phases in Gallup polling since the Great Recession. In the first phase, from 2010 to 2013, an average 42% of all workers said they were not at all likely to lose their jobs. In the second phase, from 2014 to 2016, the average rose to 52%; and in the third phase, spanning 2017 and 2018, it climbed again, to 61%.
The aggregated data for each phase provide more reliable estimates for overall layoff fears, as well as the ability to evaluate worker subgroups. Each of the three periods has brought different reactions among key subgroups, with gaps opening between some groups at the same time differences were disappearing between others:
- Income has been a factor during all three periods. Those with annual household incomes of less than $30,000 are significantly less likely than those in higher income brackets to have total confidence in holding their jobs.
- Partisanship also appears to be a factor. In the 2010-2013 phase, with Democrat Barack Obama in the White House, Republicans were slightly less likely to show confidence about job security. In the second phase, with Obama still president, the gap between Republicans and Democrats disappeared. But since the transition to Republican President Donald Trump in 2017, Republicans have become significantly more confident, with 67% saying it is not at all likely they will lose their jobs, compared with 55% of Democrats.
- Those with a college degree had been slightly more likely to have total confidence in their job security from 2010 through 2016, but are now no more likely to be totally confident than those without a degree.
| 2010, 2012-2013 | 2014-2016 | 2017-2018 | ||||||||||||||||||||||||||||||||||||||||||||||||||||||||||||||||||||||||||||||||||||||||||||||||||
|---|---|---|---|---|---|---|---|---|---|---|---|---|---|---|---|---|---|---|---|---|---|---|---|---|---|---|---|---|---|---|---|---|---|---|---|---|---|---|---|---|---|---|---|---|---|---|---|---|---|---|---|---|---|---|---|---|---|---|---|---|---|---|---|---|---|---|---|---|---|---|---|---|---|---|---|---|---|---|---|---|---|---|---|---|---|---|---|---|---|---|---|---|---|---|---|---|---|---|---|---|
| % | % | % | ||||||||||||||||||||||||||||||||||||||||||||||||||||||||||||||||||||||||||||||||||||||||||||||||||
| All adults | 42 | 52 | 61 | |||||||||||||||||||||||||||||||||||||||||||||||||||||||||||||||||||||||||||||||||||||||||||||||||
| Party ID | ||||||||||||||||||||||||||||||||||||||||||||||||||||||||||||||||||||||||||||||||||||||||||||||||||||
| Democrats and leaners | 45 | 53 | 55 | |||||||||||||||||||||||||||||||||||||||||||||||||||||||||||||||||||||||||||||||||||||||||||||||||
| Republicans and leaners | 39 | 53 | 67 | |||||||||||||||||||||||||||||||||||||||||||||||||||||||||||||||||||||||||||||||||||||||||||||||||
| Annual household income | ||||||||||||||||||||||||||||||||||||||||||||||||||||||||||||||||||||||||||||||||||||||||||||||||||||
| Less than $30,000 | 29 | 39 | 48 | |||||||||||||||||||||||||||||||||||||||||||||||||||||||||||||||||||||||||||||||||||||||||||||||||
| $30,000-<$75,000 | 42 | 48 | 58 | |||||||||||||||||||||||||||||||||||||||||||||||||||||||||||||||||||||||||||||||||||||||||||||||||
| $75,000 or more | 48 | 63 | 67 | |||||||||||||||||||||||||||||||||||||||||||||||||||||||||||||||||||||||||||||||||||||||||||||||||
| Education | ||||||||||||||||||||||||||||||||||||||||||||||||||||||||||||||||||||||||||||||||||||||||||||||||||||
| College graduate | 44 | 56 | 60 | |||||||||||||||||||||||||||||||||||||||||||||||||||||||||||||||||||||||||||||||||||||||||||||||||
| Not a college graduate | 40 | 49 | 61 | |||||||||||||||||||||||||||||||||||||||||||||||||||||||||||||||||||||||||||||||||||||||||||||||||
| Based on averages from combined years for U.S. adults employed full or part time | ||||||||||||||||||||||||||||||||||||||||||||||||||||||||||||||||||||||||||||||||||||||||||||||||||||
| GALLUP | ||||||||||||||||||||||||||||||||||||||||||||||||||||||||||||||||||||||||||||||||||||||||||||||||||||
Bottom Line
In 2010, with the recession barely over and unemployment still near 10%, a record-high percentage of U.S. workers thought they were very or fairly likely to lose their jobs, while a record low said they were "not at all likely" to be laid off. Since then, workers' confidence in their job security has grown steadily, and even with a slight slip this year, the proportion of workers who think it is not at all likely they will be laid off is a few percentage points above the 34-year average of 56%.
Some might yearn for the good old days of the 1970s, when more than 60% were totally confident about their job security even when unemployment was significantly higher than it is today. But with Americans being told on a regular basis that job security is a thing of the past, both employers and employees can be heartened that once again, a solid majority of U.S. workers have total confidence that they will not have to be searching for a new job within the next year.
Survey Methods
Results for this Gallup poll are based on telephone interviews conducted April 2-11, 2018, on the Gallup with a random sample of 547 adults employed full time or part time, aged 18 and older, living in all 50 U.S. states and the District of Columbia. For results based on the total sample of employed adults, the margin of sampling error is ±5 percentage points at the 95% confidence level. All reported margins of sampling error include computed design effects for weighting.
Each sample of national adults includes a minimum quota of 70% cellphone respondents and 30% landline respondents, with additional minimum quotas by time zone within region. Landline and cellular telephone numbers are selected using random-digit-dial methods.
View survey methodology, complete question responses and trends.
Learn more about how the Gallup Poll Social Series works.


