Story Highlights
- 64% expect local home prices to increase
- After housing crash, more expected price drops than increases
- Two-thirds say it is a good time to buy a house
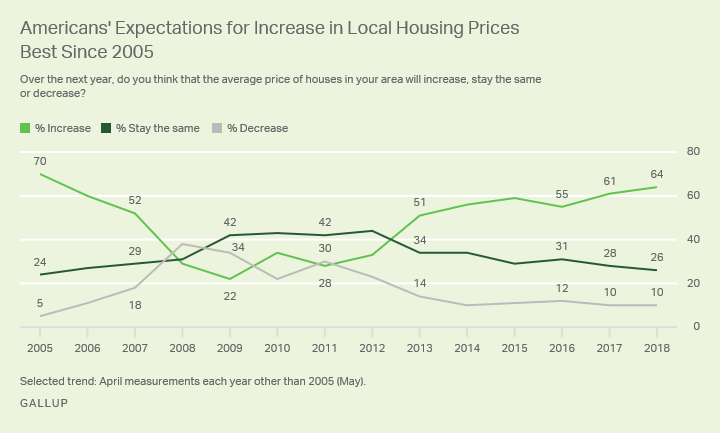
WASHINGTON, D.C. -- Americans continue to believe home prices in their local area will rise, as 64% expect an increase during the next year. That is up nine percentage points in the past two years and is the highest Gallup has measured since the emergence of the housing bubble in the mid-2000s.

The results are based on Gallup's annual Economy and Personal Finance poll, conducted April 2-11. Annually since 2005, Gallup has asked Americans to predict whether home prices in their area will increase, stay the same or decrease over the next 12 months.
In the initial survey, a record 70% of U.S. adults thought local home prices would rise in the coming year. That number quickly descended over the next two years, to 52% in April 2007.
By 2008, after the housing bubble burst, more Americans expected housing prices to decrease (38%) than to increase (29%). In the ensuing years, as the economy and housing market recovered, so too did Americans' assessments of the housing market. By 2013, a majority of 51% once again expected prices to increase. The percentage has continued to grow since then, topping 60% in each of the last two years.
These attitudes are consistent with the trends in home prices nationally, which have steadily risen since 2012.
As has been the case in recent years, those residing in the Western United States are most likely to expect home prices to go up. Many of the markets with the fastest-rising home prices are in the West, including in California, Nevada, Utah and Washington state.
Currently, 79% of Western residents predict an increase in local home prices, as do 64% of Southern residents, 56% of Midwestern residents and 58% of Eastern residents. Since 2016, there have been meaningful increases in the percentage of residents expecting home values to rise in all regions but the South.
| 2016 | 2018 | Change | |||||||||||||||||||||||||||||||||||||||||||||||||||||||||||||||||||||||||||||||||||||||||||||||||
|---|---|---|---|---|---|---|---|---|---|---|---|---|---|---|---|---|---|---|---|---|---|---|---|---|---|---|---|---|---|---|---|---|---|---|---|---|---|---|---|---|---|---|---|---|---|---|---|---|---|---|---|---|---|---|---|---|---|---|---|---|---|---|---|---|---|---|---|---|---|---|---|---|---|---|---|---|---|---|---|---|---|---|---|---|---|---|---|---|---|---|---|---|---|---|---|---|---|---|---|
| % Increase | % Increase | pct. pts. | |||||||||||||||||||||||||||||||||||||||||||||||||||||||||||||||||||||||||||||||||||||||||||||||||
| East | 48 | 58 | +10 | ||||||||||||||||||||||||||||||||||||||||||||||||||||||||||||||||||||||||||||||||||||||||||||||||
| Midwest | 45 | 56 | +11 | ||||||||||||||||||||||||||||||||||||||||||||||||||||||||||||||||||||||||||||||||||||||||||||||||
| South | 61 | 64 | +3 | ||||||||||||||||||||||||||||||||||||||||||||||||||||||||||||||||||||||||||||||||||||||||||||||||
| West | 64 | 79 | +15 | ||||||||||||||||||||||||||||||||||||||||||||||||||||||||||||||||||||||||||||||||||||||||||||||||
| Gallup | |||||||||||||||||||||||||||||||||||||||||||||||||||||||||||||||||||||||||||||||||||||||||||||||||||
Americans Continue to Endorse Home Buying
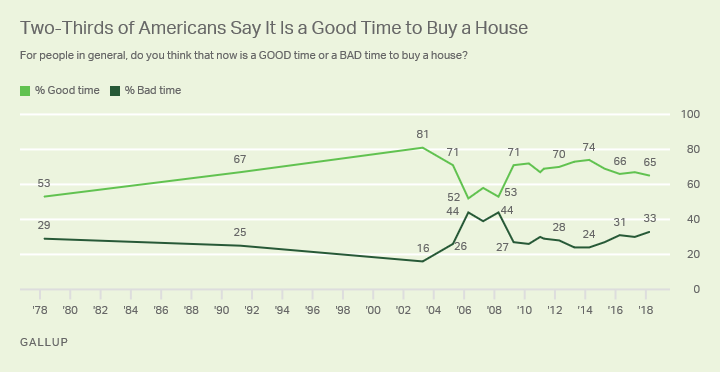
With both home prices and interest rates rising, the housing market is not as favorable to buyers as it was a few years ago. But most Americans, 65%, continue to say it is a good time to buy a house. This remains down from 74% in 2014 but is still higher than the lows near 50% between 2006 and 2008, the years spanning the peak of the housing bubble and the subsequent crash in prices.

Gallup first asked this question in 1978, and to date, the percentage saying it is a good time to buy a house has never fallen below 50%. To some degree, Americans may answer the question in terms of both housing market conditions and their views about buying a house as a long-term investment. Americans have generally regarded real estate as a better investment than other options.
Along with 2006-2008, 1978 represented another low point. That year, interest rates on mortgages were around 10%.
The all-time high percentage saying it is a good time to buy a house was 81% in 2003, when home prices were increasing rapidly and the federal government and banks were devising policies to increase homeownership.
Majorities of all major subgroups believe it is now a good time to buy a house. That includes 70% of homeowners and 59% of renters. Those in the West, where buyers face increasingly expensive homes, are slightly less likely than those in other regions to say it is a good time to purchase a home. Fifty-nine percent of Western residents hold this view, compared with between 65% and 68% in the other regions.
Upper-income Americans (76%) are much more likely than middle- (63%) and lower-income Americans (55%) to think it is a good time to buy a home.
Implications
High demand and limited supply of homes are putting upward pressure on home prices, leading many real estate experts to urge prospective buyers to get into the market now, before rising prices and interest rates make homes too expensive to afford. Americans appear to be aware of housing market conditions, with their opinions of whether home prices will rise trending in the same direction as U.S. home prices. But they also may be aware that it is becoming more of a seller's market than a buyer's market. While they remain optimistic that it is a good time to purchase a home, they are less optimistic than they were four years ago, when houses were more affordable and interest rates were lower.
Survey Methods
Results for this Gallup poll are based on telephone interviews conducted April 2-11, 2018, with a random sample of 1,015 adults, aged 18 and older, living in all 50 U.S. states and the District of Columbia. For results based on the total sample of national adults, the margin of sampling error is ±4 percentage points at the 95% confidence level.
All reported margins of sampling error include computed design effects for weighting.
Each sample of national adults includes a minimum quota of 70% cellphone respondents and 30% landline respondents, with additional minimum quotas by time zone within region. Landline and cellular telephone numbers are selected using random-digit-dial methods.
View survey methodology, complete question responses and trends.
Learn more about how the Gallup Poll Social Series works.


