Story Highlights
- Beer reclaimed sole status as top dog in 2014, after falling to 36% early this decade
- Beer rising in popularity with more educated, higher-income Americans
- Overall drinking rate in U.S. steady at 63%
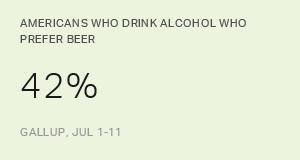
WASHINGTON, D.C -- Americans who drink alcohol continue to say they most often choose beer (42%) over wine (34%) and liquor (19%), after wine and beer essentially tied between 2011 and 2013.
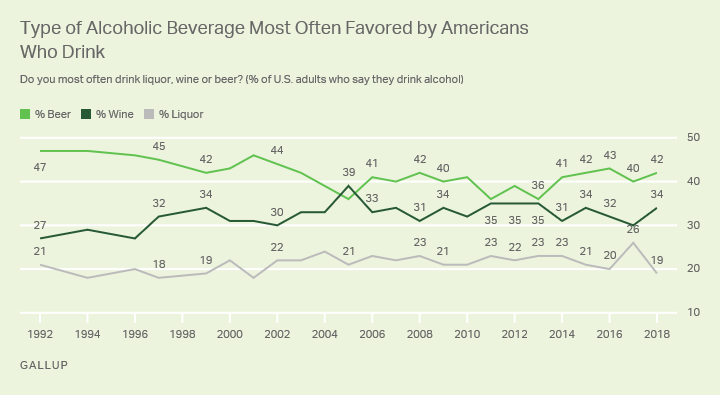
Beer has almost always been Americans' preferred alcoholic beverage since Gallup began tracking this question in 1992. However, preferences have not been entirely static for the past quarter century. In the mid-2000s, the sizeable advantage beer held over its next-closest alternative, wine, shrank substantially, and the two were effectively tied in 2005.
Still, beer quickly regained its status as Americans' most favored alcoholic beverage in 2006. But in the early years of this decade, wine again shared the popularity throne with beer, as the latter drink became less popular with U.S. drinkers between the ages of 18 and 29. In both 2011 and 2013, preference for beer fell to 36%, the lowest reading on record.
Beer again re-took its top-dog status in 2014 and has enjoyed that place since.
A less numerous, though stable, portion of American drinkers prefer liquor over the other two types of alcohol -- generally around a fifth over the past two decades.
Beer Has Become More Popular With Older, More Affluent Drinkers
The overall rise in beer's popularity in recent years has generally been the result of the beverage reclaiming the ground it lost with key demographics in the earlier years of the decade, rather than due to a changing consumer base. However, there are notable exceptions to this trend, particularly with older Americans.
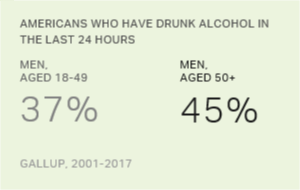
For the combined years from 2014 to 2018, 42% of U.S. drinkers aged 50 to 64 said their preferred alcoholic beverage was beer. This is not only nine percentage points higher than what was recorded from 2011 to 2013 -- a time period when beer was comparatively less popular with all imbibing Americans -- but also notably above the 35% of 50- to 64-year-olds who preferred beer in the years from 2001 to 2010. Likewise, from 2014 to 2018, preference for beer among Americans aged 65 and older rose to 29% from the 23% recorded in 2011 to 2013, though this more recent figure is closer to the 2001 to 2010 average for this group (26%).
Meanwhile, younger Americans aged 18 to 29, who turned markedly away from beer from 2011 to 2013, have become fonder of the beverage in the past five years, though not to the same extent as before 2011.
| 2001 to 2010 | 2011 to 2013 | 2014 to 2018 | ||||||||||||||||||||||||||||||||||||||||||||||||||||||||||||||||||||||||||||||||||||||||||||||||||
|---|---|---|---|---|---|---|---|---|---|---|---|---|---|---|---|---|---|---|---|---|---|---|---|---|---|---|---|---|---|---|---|---|---|---|---|---|---|---|---|---|---|---|---|---|---|---|---|---|---|---|---|---|---|---|---|---|---|---|---|---|---|---|---|---|---|---|---|---|---|---|---|---|---|---|---|---|---|---|---|---|---|---|---|---|---|---|---|---|---|---|---|---|---|---|---|---|---|---|---|---|
| % | % | % | ||||||||||||||||||||||||||||||||||||||||||||||||||||||||||||||||||||||||||||||||||||||||||||||||||
| U.S. Adults Who Drink | 41 | 37 | 42 | |||||||||||||||||||||||||||||||||||||||||||||||||||||||||||||||||||||||||||||||||||||||||||||||||
| Age | ||||||||||||||||||||||||||||||||||||||||||||||||||||||||||||||||||||||||||||||||||||||||||||||||||||
| 18 to 29 | 49 | 41 | 45 | |||||||||||||||||||||||||||||||||||||||||||||||||||||||||||||||||||||||||||||||||||||||||||||||||
| 30 to 49 | 46 | 42 | 47 | |||||||||||||||||||||||||||||||||||||||||||||||||||||||||||||||||||||||||||||||||||||||||||||||||
| 50 to 64 | 35 | 33 | 42 | |||||||||||||||||||||||||||||||||||||||||||||||||||||||||||||||||||||||||||||||||||||||||||||||||
| 65 and older | 26 | 23 | 29 | |||||||||||||||||||||||||||||||||||||||||||||||||||||||||||||||||||||||||||||||||||||||||||||||||
| Gender | ||||||||||||||||||||||||||||||||||||||||||||||||||||||||||||||||||||||||||||||||||||||||||||||||||||
| Male | 57 | 52 | 59 | |||||||||||||||||||||||||||||||||||||||||||||||||||||||||||||||||||||||||||||||||||||||||||||||||
| Female | 25 | 21 | 24 | |||||||||||||||||||||||||||||||||||||||||||||||||||||||||||||||||||||||||||||||||||||||||||||||||
| Education | ||||||||||||||||||||||||||||||||||||||||||||||||||||||||||||||||||||||||||||||||||||||||||||||||||||
| College graduate | 35 | 32 | 38 | |||||||||||||||||||||||||||||||||||||||||||||||||||||||||||||||||||||||||||||||||||||||||||||||||
| Not a college graduate | 45 | 39 | 44 | |||||||||||||||||||||||||||||||||||||||||||||||||||||||||||||||||||||||||||||||||||||||||||||||||
| Yearly Household Income | ||||||||||||||||||||||||||||||||||||||||||||||||||||||||||||||||||||||||||||||||||||||||||||||||||||
| Less than $30,000 | 44 | 40 | 41 | |||||||||||||||||||||||||||||||||||||||||||||||||||||||||||||||||||||||||||||||||||||||||||||||||
| $30,000 to $74,999 | 44 | 39 | 44 | |||||||||||||||||||||||||||||||||||||||||||||||||||||||||||||||||||||||||||||||||||||||||||||||||
| $75,000 or more | 37 | 34 | 39 | |||||||||||||||||||||||||||||||||||||||||||||||||||||||||||||||||||||||||||||||||||||||||||||||||
| Gallup | ||||||||||||||||||||||||||||||||||||||||||||||||||||||||||||||||||||||||||||||||||||||||||||||||||||
In the past five years, beer has also become more popular with men, college graduates and Americans living in households earning $75,000 or more per year -- though, largely speaking, beer is about as popular with these groups now as it was from 2001 to 2010.
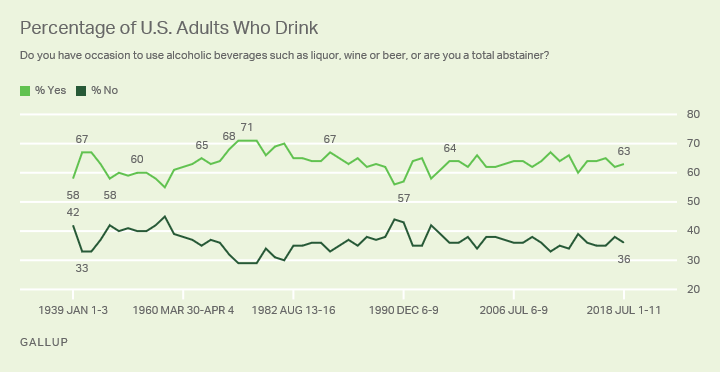
National Drinking Rate Remains Above Six in 10
In 2018, 63% of U.S. adults say they drink alcoholic beverages, matching the historical average since Gallup first asked this question in 1939. Slightly fewer than four in 10 Americans (36%) say they do not drink alcohol.
Past Gallup research has found that higher-income and more educated Americans are more likely than those in lower socio-economic status groups to say they drink alcohol.
Survey Methods
Results for this Gallup poll are based on telephone interviews conducted July 1-11, 2018, with a random sample of 1,033 adults, aged 18 and older, living in all 50 U.S. states and the District of Columbia. For results based on the total sample of national adults, the margin of sampling error is ±4 percentage points at the 95% confidence level. For results based on the sample of 678 adults who drink alcoholic beverages, the maximum margin of sampling error is ±4 percentage points. All reported margins of sampling error include computed design effects for weighting.
Each sample of national adults includes a minimum quota of 70% cellphone respondents and 30% landline respondents, with additional minimum quotas by time zone within region. Landline and cellular telephone numbers are selected using random-digit-dial methods.
View survey methodology, complete question responses and trends.
Learn more about how the Gallup Poll Social Series works.