Story Highlights
- 27% of U.S. adults say they have a pre-existing condition
- An additional 17% say an immediate family member does
- Older Americans most likely to have pre-existing conditions
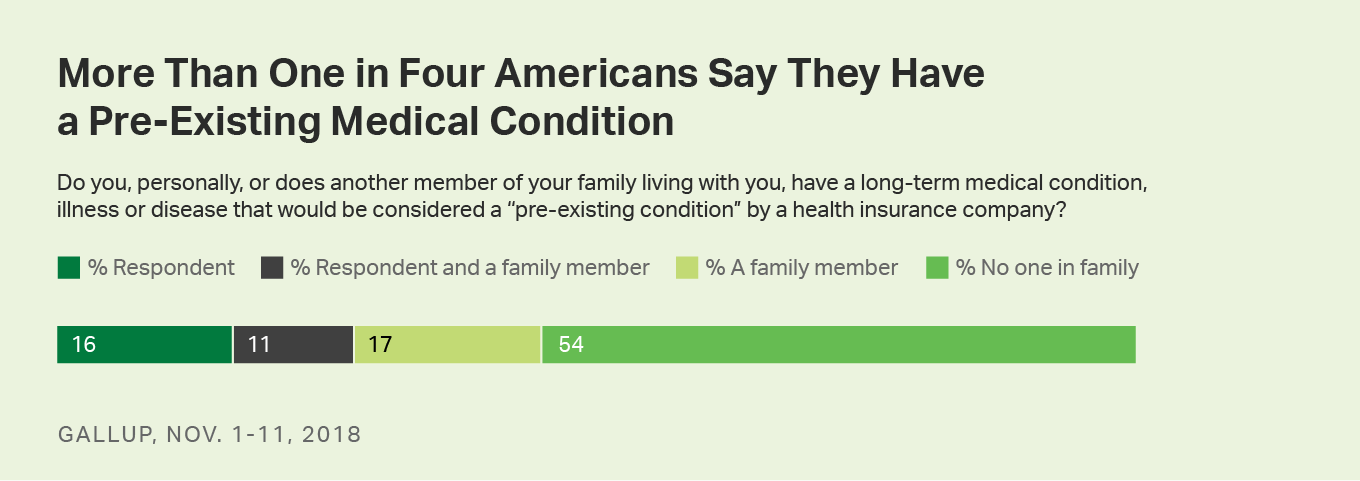
WASHINGTON, D.C. -- Twenty-seven percent of U.S. adults say they personally have a long-term medical condition, illness or disease that a health insurance company would consider a pre-existing condition. This includes 16% who are the only family member in their home with such a condition and 11% who live with a family member who also has a pre-existing condition.

An additional 17% of U.S. adults say they do not personally have a pre-existing condition but another family member in their household does. Altogether, then, nearly half of Americans (44%) reside in a household in which someone has a pre-existing condition.
The data were collected in Gallup's annual Health and Healthcare survey, conducted Nov. 1-11, and are based on self-reports from respondents. The survey did not probe for the nature of the pre-existing condition.
Democratic candidates for Congress made protections for those with pre-existing conditions a major issue in this year's midterm elections. The 2010 Affordable Care Act made it illegal for health insurers to deny coverage, charge higher premiums or put lifetime benefit limits on people with pre-existing medical conditions. Republican legislation to repeal the ACA would have weakened protections for pre-existing conditions. Most notably, the American Health Care Act that passed the House of Representatives in May 2017 would have allowed insurers to charge higher rates to those with pre-existing conditions.
Definitions of pre-existing conditions vary because individual insurance companies primarily determine what qualifies as a pre-existing condition and what does not. These may include cancer or heart disease but also asthma, high blood pressure or obesity. A government report found that between 19% and 50% of nonelderly Americans have a pre-existing condition, depending on how the term is defined. In the Gallup data, 24% of nonelderly Americans (those younger than age 65) say they have a pre-existing condition. The percentage is even lower, 16%, among adults younger than 30.
Senior citizens, who are mostly covered under Medicare, are much more likely to report personally having a pre-existing condition, with 38% saying they do.
In addition to older Americans, those who say they are overweight are especially likely to report having a pre-existing condition -- 34% do, compared with 22% who describe themselves as being normal weight or underweight.
Two other subgroups with above-average rates of pre-existing conditions are those of pre-retirement age (50 to 64) and lower-income Americans. The higher rate for the latter group may reflect lower average incomes among senior citizens.
| Respondent, personally | Respondent or family member | ||||||||||||||||||||||||||||||||||||||||||||||||||||||||||||||||||||||||||||||||||||||||||||||||||
|---|---|---|---|---|---|---|---|---|---|---|---|---|---|---|---|---|---|---|---|---|---|---|---|---|---|---|---|---|---|---|---|---|---|---|---|---|---|---|---|---|---|---|---|---|---|---|---|---|---|---|---|---|---|---|---|---|---|---|---|---|---|---|---|---|---|---|---|---|---|---|---|---|---|---|---|---|---|---|---|---|---|---|---|---|---|---|---|---|---|---|---|---|---|---|---|---|---|---|---|
| % | % | ||||||||||||||||||||||||||||||||||||||||||||||||||||||||||||||||||||||||||||||||||||||||||||||||||
| All U.S. adults | 27 | 44 | |||||||||||||||||||||||||||||||||||||||||||||||||||||||||||||||||||||||||||||||||||||||||||||||||
| 65+ years old | 38 | 55 | |||||||||||||||||||||||||||||||||||||||||||||||||||||||||||||||||||||||||||||||||||||||||||||||||
| 50-64 years old | 34 | 51 | |||||||||||||||||||||||||||||||||||||||||||||||||||||||||||||||||||||||||||||||||||||||||||||||||
| Lower income (annual household income less than $30,000) | 34 | 52 | |||||||||||||||||||||||||||||||||||||||||||||||||||||||||||||||||||||||||||||||||||||||||||||||||
| Overweight | 34 | 52 | |||||||||||||||||||||||||||||||||||||||||||||||||||||||||||||||||||||||||||||||||||||||||||||||||
| Democrat | 32 | 53 | |||||||||||||||||||||||||||||||||||||||||||||||||||||||||||||||||||||||||||||||||||||||||||||||||
| Woman | 31 | 50 | |||||||||||||||||||||||||||||||||||||||||||||||||||||||||||||||||||||||||||||||||||||||||||||||||
| White | 30 | 47 | |||||||||||||||||||||||||||||||||||||||||||||||||||||||||||||||||||||||||||||||||||||||||||||||||
| Suburban resident | 30 | 49 | |||||||||||||||||||||||||||||||||||||||||||||||||||||||||||||||||||||||||||||||||||||||||||||||||
| Town/Rural resident | 30 | 51 | |||||||||||||||||||||||||||||||||||||||||||||||||||||||||||||||||||||||||||||||||||||||||||||||||
| Middle income (annual household income $30,000-$74,999) | 26 | 44 | |||||||||||||||||||||||||||||||||||||||||||||||||||||||||||||||||||||||||||||||||||||||||||||||||
| Republican | 25 | 41 | |||||||||||||||||||||||||||||||||||||||||||||||||||||||||||||||||||||||||||||||||||||||||||||||||
| Independent | 25 | 41 | |||||||||||||||||||||||||||||||||||||||||||||||||||||||||||||||||||||||||||||||||||||||||||||||||
| Man | 23 | 39 | |||||||||||||||||||||||||||||||||||||||||||||||||||||||||||||||||||||||||||||||||||||||||||||||||
| Upper income (annual household income $75,000 or more) | 23 | 42 | |||||||||||||||||||||||||||||||||||||||||||||||||||||||||||||||||||||||||||||||||||||||||||||||||
| City resident | 23 | 38 | |||||||||||||||||||||||||||||||||||||||||||||||||||||||||||||||||||||||||||||||||||||||||||||||||
| 30-49 years old | 22 | 38 | |||||||||||||||||||||||||||||||||||||||||||||||||||||||||||||||||||||||||||||||||||||||||||||||||
| Normal weight/Underweight | 22 | 39 | |||||||||||||||||||||||||||||||||||||||||||||||||||||||||||||||||||||||||||||||||||||||||||||||||
| Nonwhite | 20 | 38 | |||||||||||||||||||||||||||||||||||||||||||||||||||||||||||||||||||||||||||||||||||||||||||||||||
| 18-29 years old | 16 | 37 | |||||||||||||||||||||||||||||||||||||||||||||||||||||||||||||||||||||||||||||||||||||||||||||||||
| Nov. 1-11, 2018 | |||||||||||||||||||||||||||||||||||||||||||||||||||||||||||||||||||||||||||||||||||||||||||||||||||
| Gallup | |||||||||||||||||||||||||||||||||||||||||||||||||||||||||||||||||||||||||||||||||||||||||||||||||||
There is also a disparity in pre-existing conditions by race -- 30% of whites say they have such a condition versus 20% of nonwhites. However, this may be explained by age, as the median age of U.S. whites is much higher than the median age of nonwhites. Relatedly, whites are twice as likely as nonwhites to be senior citizens, 16% vs. 7%.
The reasons for higher self-reports of pre-existing conditions for Democrats (32%) than for Republicans and independents (25%) cannot be explained by age. Republicans tend to be older than Democrats. Nor can it be explained by weight, as Republicans and Democrats are equally likely to report being overweight. It may be that Democrats are more sensitive to the pre-existing condition debate, given the strong push by Democratic candidates this fall, and thus more likely to report having such a condition.
Senior citizens are also the group most likely to report having a family member (including themselves) with a pre-existing condition -- 55% do.
Implications
U.S. healthcare laws that govern insurance coverage for those with pre-existing conditions are not a trivial matter. Close to half of Americans could be directly affected by those laws, as they or a household family member have a pre-existing condition. The issue became a powerful campaign talking point for Democrats in this year's midterm elections, which saw the party win control of the House of Representatives. Many Republicans who were put on the defensive for trying to change the healthcare laws maintained they wanted to preserve protections for pre-existing conditions in new healthcare legislation. As such, this could be one issue on which Democrats and Republicans can work together to find solutions that would benefit many Americans.
View complete question responses and trends.
Learn more about how the Gallup Poll Social Series works.


