Story Highlights
- Half of U.S. workers expect a negative effect on workplace
- Democrats, women expect more negative workplace effects
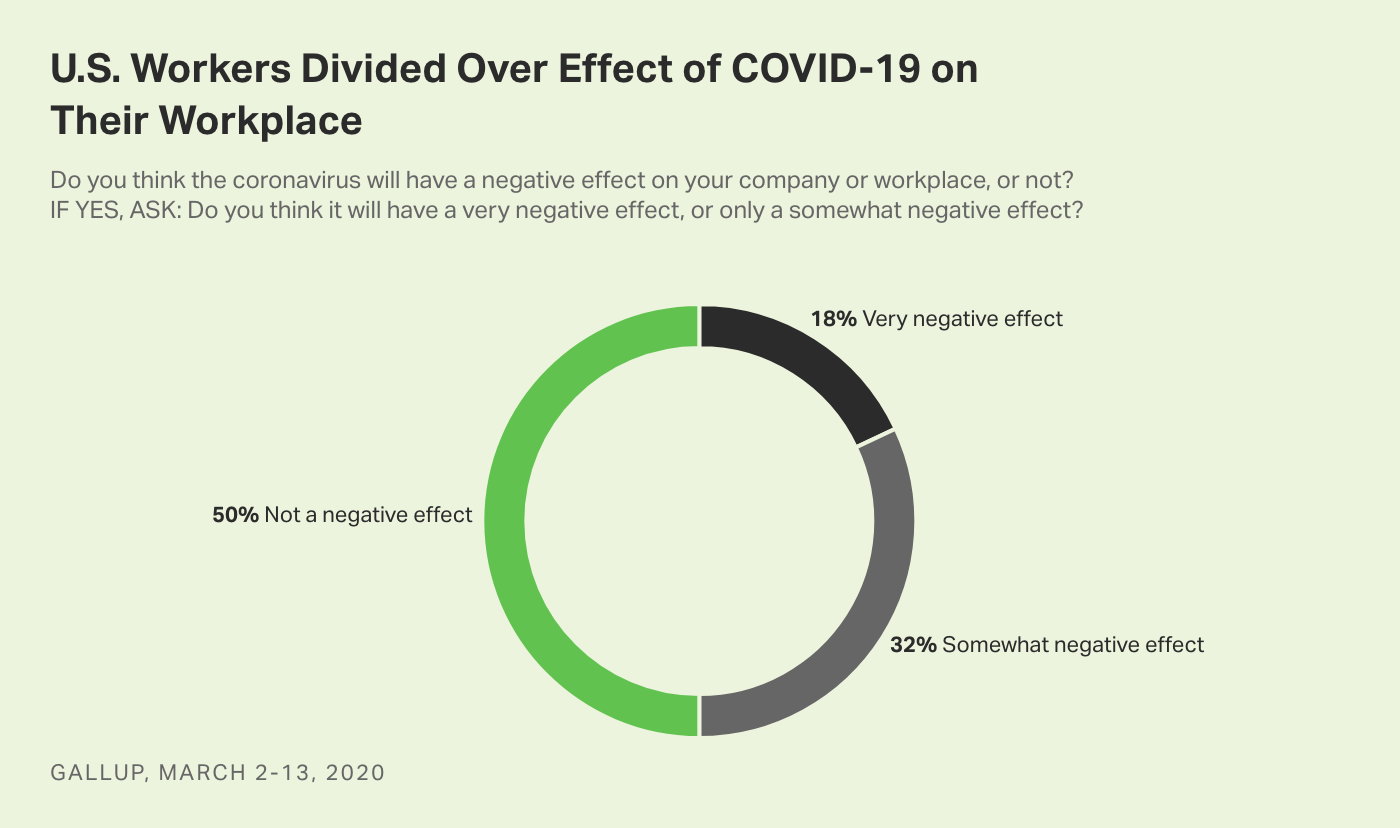
WASHINGTON, D.C. -- As U.S. employers rapidly adapt their workplaces to avoid further community spread of COVID-19, American workers offer a mixed assessment of how the disease will affect their place of work. Half say COVID-19 will have a negative effect on their company or workplace -- either very (18%) or somewhat negative (32%) -- while 50% say it will not negatively affect their workplace.

These findings are from a Gallup poll conducted March 2-13 as the U.S. was beginning to grapple with the novel coronavirus pandemic. During this period, many American employers were exploring ways to keep employees and their communities safe while also maintaining their businesses. All interviews were completed before the Centers for Disease Control and Prevention on Sunday recommended an eight-week hiatus on gatherings of 50 or more people.
The partisan nature of coronavirus attitudes nationwide is mirrored here, as expectations about the workplace effect of COVID-19 among U.S. workers who identify as Democrats are more negative than those among workers who identify as Republicans.
Likewise, women are more likely than men to think COVID-19 will negatively affect their workplace. In addition to being more likely to identify as Democrats, women are more likely than men to work part-time jobs, which may be more susceptible to workplace disruption during this time.
| Very negative effect | Somewhat negative effect | Not a negative effect | ||||||||||||||||||||||||||||||||||||||||||||||||||||||||||||||||||||||||||||||||||||||||||||||||||
|---|---|---|---|---|---|---|---|---|---|---|---|---|---|---|---|---|---|---|---|---|---|---|---|---|---|---|---|---|---|---|---|---|---|---|---|---|---|---|---|---|---|---|---|---|---|---|---|---|---|---|---|---|---|---|---|---|---|---|---|---|---|---|---|---|---|---|---|---|---|---|---|---|---|---|---|---|---|---|---|---|---|---|---|---|---|---|---|---|---|---|---|---|---|---|---|---|---|---|---|---|
| % | % | % | ||||||||||||||||||||||||||||||||||||||||||||||||||||||||||||||||||||||||||||||||||||||||||||||||||
| Gender | ||||||||||||||||||||||||||||||||||||||||||||||||||||||||||||||||||||||||||||||||||||||||||||||||||||
| Men | 15 | 31 | 52 | |||||||||||||||||||||||||||||||||||||||||||||||||||||||||||||||||||||||||||||||||||||||||||||||||
| Women | 20 | 33 | 46 | |||||||||||||||||||||||||||||||||||||||||||||||||||||||||||||||||||||||||||||||||||||||||||||||||
| Party ID | ||||||||||||||||||||||||||||||||||||||||||||||||||||||||||||||||||||||||||||||||||||||||||||||||||||
| Republicans/Republican-leaning independents | 10 | 26 | 62 | |||||||||||||||||||||||||||||||||||||||||||||||||||||||||||||||||||||||||||||||||||||||||||||||||
| Democrats/Democratic-leaning independents | 23 | 37 | 40 | |||||||||||||||||||||||||||||||||||||||||||||||||||||||||||||||||||||||||||||||||||||||||||||||||
| GALLUP, March 2-13, 2020 | ||||||||||||||||||||||||||||||||||||||||||||||||||||||||||||||||||||||||||||||||||||||||||||||||||||
Learn more about how the Gallup Poll Social Series works.


