Story Highlights
- Percentage who are "thriving" has dropped to Great Recession levels
- Current satisfaction, not one's anticipated future life, is cause of decline
- Daily significant stress and worry have spiked with unprecedented magnitude
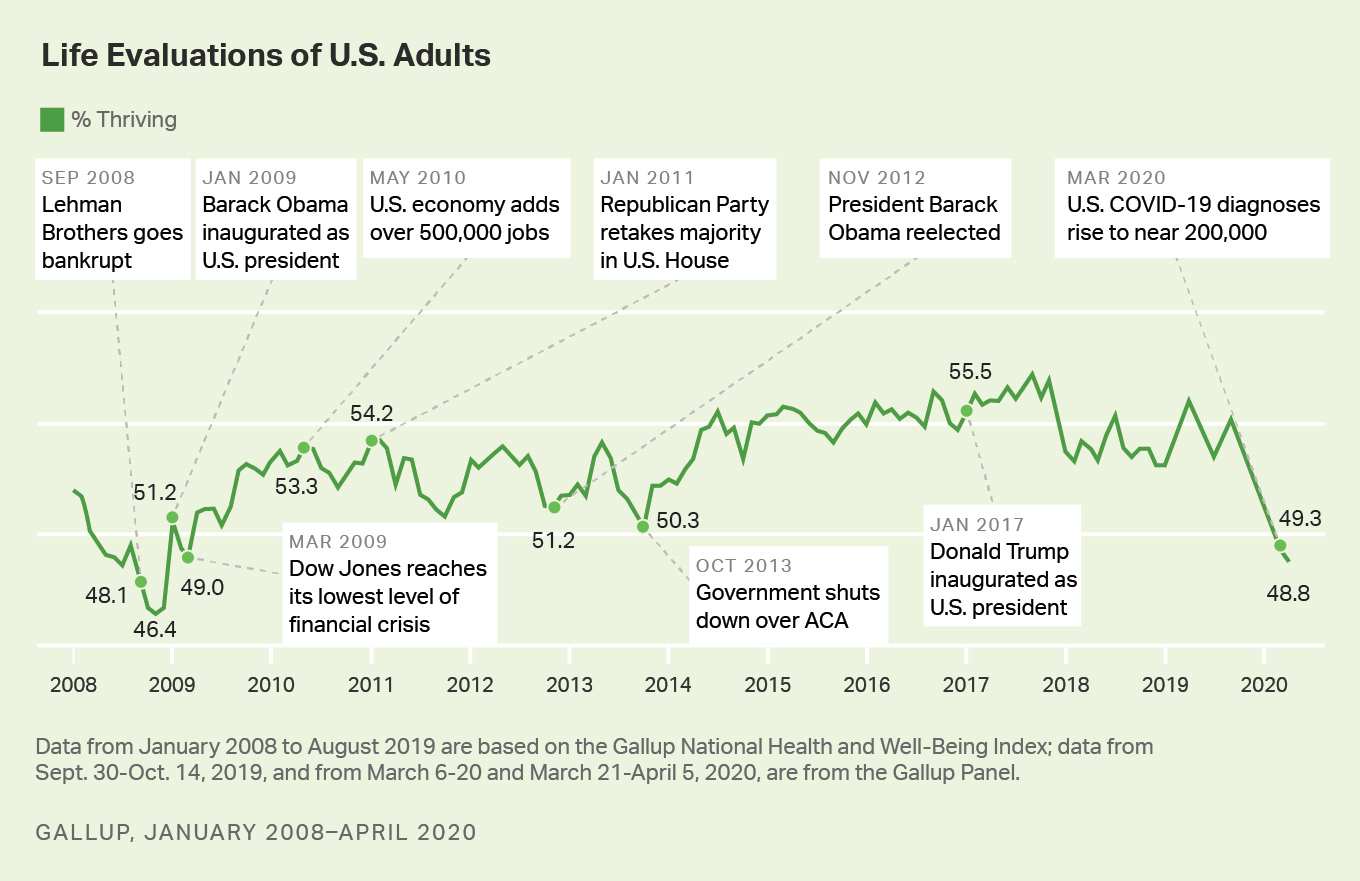
WASHINGTON, D.C. -- The percentage of U.S. adults who evaluate their lives well enough to be considered "thriving" has dropped to 48.8%, the lowest level since the Great Recession in December 2008. Today's thriving rate has edged down from 49.3% in early March and has declined by 6.5 percentage points since October's 55.3%, the most recent gauge before the start of the COVID-19 crisis. It is the sixth-lowest percentage recorded in near-monthly measurements since January 2008. The lowest five all occurred in 2008.
Gallup classifies Americans as "thriving," "struggling" or "suffering" according to how they rate their current and future lives on a ladder scale with steps numbered from 0 to 10, based on the Cantril Self-Anchoring Striving Scale. Those who rate their present life a 7 or higher and their life in five years an 8 or higher are classified as thriving.
The most recent results, captured March 21-April 5, 2020, are based on interviews with 20,006 respondents randomly selected from the Gallup Panel, a scientifically populated, non-opt-in panel of about 80,000 adults across all 50 U.S. states and the District of Columbia. The most recent results that predate the COVID-19 pandemic were based on answers from 33,451 panel respondents from Sept. 30-Oct. 14, 2019. All previous estimates are based on samples from the Gallup National Health and Well-Being Index. Comparisons of national estimates that occurred at close to the same time in 2019 showed highly similar results between the two surveys, demonstrating their comparability.
Over the course of 2008, as the Great Recession was beginning, 48.9% of U.S. adults were classified as thriving, with low marks of 46.7% in October, 46.4% in November and 46.7% in December of that year. These remain the three lowest levels Gallup has recorded over the entire 12+ years of measurement.
Drop in Life Satisfaction Driven by Current Life Rating, Not Future
Between last fall and now, the percentage of respondents rating their satisfaction with their current life a "7" or higher has dropped by 9.5 points to 58.2%, with similar declines across all age groups. Ratings of life satisfaction five years into the future, in contrast, have improved by 2.5 points to 68.0% ("8" or higher), possibly reflecting Americans' unusually low satisfaction with their current lives -- thus leaving more room than what is typical for expected improvement in the future -- as well as a general resiliency in optimism among the American public.
The decline in the percentage who are thriving is substantially greater among adults aged 18-44 than for older age groups, dropping nearly 10 points to 45.9% for younger adults in the most recent sampling. This is heavily driven by a decline in ratings for current life satisfaction, coupled with the absence of improvement in this group's anticipated life satisfaction in five years. Among seniors, anticipated future life satisfaction is up substantially compared with September-October 2019, which has helped offset the drop in current life satisfaction, thus resulting in a smaller drop in thriving.
| Sep 30-Oct 14, 2019 | Mar 21-Apr 5, 2020 | Change (pts.) | ||||||||||||||||||||||||||||||||||||||||||||||||||||||||||||||||||||||||||||||||||||||||||||||||||
|---|---|---|---|---|---|---|---|---|---|---|---|---|---|---|---|---|---|---|---|---|---|---|---|---|---|---|---|---|---|---|---|---|---|---|---|---|---|---|---|---|---|---|---|---|---|---|---|---|---|---|---|---|---|---|---|---|---|---|---|---|---|---|---|---|---|---|---|---|---|---|---|---|---|---|---|---|---|---|---|---|---|---|---|---|---|---|---|---|---|---|---|---|---|---|---|---|---|---|---|---|
| % | % | |||||||||||||||||||||||||||||||||||||||||||||||||||||||||||||||||||||||||||||||||||||||||||||||||||
| THRIVING | ||||||||||||||||||||||||||||||||||||||||||||||||||||||||||||||||||||||||||||||||||||||||||||||||||||
| 18-44 | 55.8 | 45.9 | -9.9* | |||||||||||||||||||||||||||||||||||||||||||||||||||||||||||||||||||||||||||||||||||||||||||||||||
| 45-64 | 57.3 | 53.0 | -4.3* | |||||||||||||||||||||||||||||||||||||||||||||||||||||||||||||||||||||||||||||||||||||||||||||||||
| 65+ | 51.1 | 47.7 | -3.4* | |||||||||||||||||||||||||||||||||||||||||||||||||||||||||||||||||||||||||||||||||||||||||||||||||
| All adults | 55.3 | 48.8 | -6.5* | |||||||||||||||||||||||||||||||||||||||||||||||||||||||||||||||||||||||||||||||||||||||||||||||||
| CURRENT LIFE SATISFACTION (%7-10) | ||||||||||||||||||||||||||||||||||||||||||||||||||||||||||||||||||||||||||||||||||||||||||||||||||||
| 18-44 | 60.6 | 50.3 | -10.3* | |||||||||||||||||||||||||||||||||||||||||||||||||||||||||||||||||||||||||||||||||||||||||||||||||
| 45-64 | 70.6 | 61.7 | -8.9* | |||||||||||||||||||||||||||||||||||||||||||||||||||||||||||||||||||||||||||||||||||||||||||||||||
| 65+ | 78.6 | 68.3 | -10.3* | |||||||||||||||||||||||||||||||||||||||||||||||||||||||||||||||||||||||||||||||||||||||||||||||||
| All adults | 67.7 | 58.2 | -9.5* | |||||||||||||||||||||||||||||||||||||||||||||||||||||||||||||||||||||||||||||||||||||||||||||||||
| ANTICIPATED LIFE SATISFACTION IN 5 YRS. (%8-10) | ||||||||||||||||||||||||||||||||||||||||||||||||||||||||||||||||||||||||||||||||||||||||||||||||||||
| 18-44 | 71.6 | 71.5 | -0.1 | |||||||||||||||||||||||||||||||||||||||||||||||||||||||||||||||||||||||||||||||||||||||||||||||||
| 45-64 | 65.5 | 69.4 | +3.9* | |||||||||||||||||||||||||||||||||||||||||||||||||||||||||||||||||||||||||||||||||||||||||||||||||
| 65+ | 53.7 | 58.9 | +5.2* | |||||||||||||||||||||||||||||||||||||||||||||||||||||||||||||||||||||||||||||||||||||||||||||||||
| All adults | 65.5 | 68.0 | +2.5* | |||||||||||||||||||||||||||||||||||||||||||||||||||||||||||||||||||||||||||||||||||||||||||||||||
| * = Statistically significantly different (p<.05) | ||||||||||||||||||||||||||||||||||||||||||||||||||||||||||||||||||||||||||||||||||||||||||||||||||||
| Gallup Panel | ||||||||||||||||||||||||||||||||||||||||||||||||||||||||||||||||||||||||||||||||||||||||||||||||||||
Historically, the likelihood of thriving in life evaluation is highest among those aged 18-44 and erodes with age after that point. It is slightly lower among those aged 45-64 and much lower among seniors. This is primarily attributable to large drops in how seniors rate their anticipated lives five years hence, even as their satisfaction with their current lives improves relative to earlier points in life.
Significant Daily Stress, Worry See Unprecedented Increases
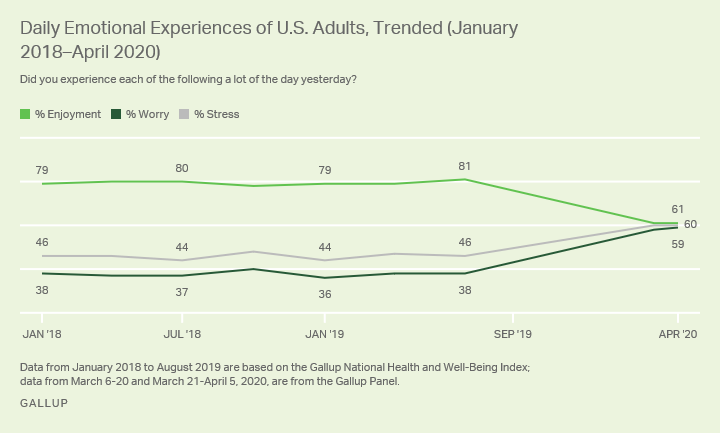
The percentages of Americans experiencing significant stress and worry on any given day are typically highly stable metrics, showing little change over time. In 2020, however, the percentages of U.S. adults experiencing significant stress and worry on a daily basis have increased in an unprecedented manner compared with July-August 2019 -- with stress rising 14 percentage points to 60% and worry rising 21 points to 59%. The percentage experiencing significant daily enjoyment, in turn, has plunged 20 points during that time to 61%.
In practical terms, about 53 million more adults were suffering significant worry on any given day in late March/early April 2020 than were experiencing the same emotion back in July/August.
Unlike the changes in general life ratings, which have disproportionately affected younger adults, changes in daily emotional experiences are similar across all age groups.
Gallup has asked the daily emotion questions as far back as 2008 in its daily telephone surveys. However, Gallup found that the results for these questions obtained by phone differed significantly from those obtained by mail or web, so it does not trend the older phone estimates with the more recent percentage estimates measured by mail or web. Still, holding the mode of interviewing constant, the magnitude of the change in the coronavirus situation is much larger than what Gallup observed in 2008, when daily worry and daily stress increased by five and three points, respectively, during the Great Recession. Nearly two years passed before stress and worry eventually dropped to early 2008 levels. The Gallup World Poll's phone-based estimates determined 5 to 6 percentage-point increases in daily stress and worry between 2017 and 2018, intensifications that roughly matched what was measured in 2008.
In 2020, the changes compared with the late summer of 2019 vastly exceed what occurred in 2008. The decline in significant daily enjoyment -- about 20 points -- is particularly noteworthy, given the absence of change in 2008.
| Enjoyment | Worry | Stress | |||||||||||||||||||||||||||||||||||||||||||||||||||||||||||||||||||||||||||||||||||||||||||||||||
|---|---|---|---|---|---|---|---|---|---|---|---|---|---|---|---|---|---|---|---|---|---|---|---|---|---|---|---|---|---|---|---|---|---|---|---|---|---|---|---|---|---|---|---|---|---|---|---|---|---|---|---|---|---|---|---|---|---|---|---|---|---|---|---|---|---|---|---|---|---|---|---|---|---|---|---|---|---|---|---|---|---|---|---|---|---|---|---|---|---|---|---|---|---|---|---|---|---|---|---|
| October 2008 vs. January 2008 | +1.1 | +5.0 | +3.3 | ||||||||||||||||||||||||||||||||||||||||||||||||||||||||||||||||||||||||||||||||||||||||||||||||
| March 21-April 7, 2020 vs. July-August 2019 | -19.7 | +20.8 | +14.0 | ||||||||||||||||||||||||||||||||||||||||||||||||||||||||||||||||||||||||||||||||||||||||||||||||
| 2008 and 2019 data are based on the Gallup National Health and Well-Being Index; 2020 data are based on the Gallup Panel | |||||||||||||||||||||||||||||||||||||||||||||||||||||||||||||||||||||||||||||||||||||||||||||||||||
| Gallup | |||||||||||||||||||||||||||||||||||||||||||||||||||||||||||||||||||||||||||||||||||||||||||||||||||
Implications
U.S. adults' life evaluations are currently approximating levels last measured at the onset of the Great Recession, when the financial crisis, coupled with the rapid decline in the labor market, played an instrumental role in suppressing life evaluations nationally. Prior research has shown a positive link between economic wellbeing and how Americans evaluate their lives, which likely has played a role in the uneven but generally steady rise in the percentage of "thriving" adults from 2009 to 2011 and -- after three years of stagnant trending -- from 2014 to 2019. About 10 million people applied for unemployment benefits (PDF download) during the last two weeks in March 2020, with a loss of 701,000 nonfarm payroll jobs over the course of the month.
The decline in the percentage of adults who are thriving is explained by declines in evaluations of their current lives, with a slight improvement in anticipated wellbeing in the next five years. These results indicate a resiliency in Americans' optimism, insulated from the effects of a pandemic that is widely assumed to be greatly diminished by the end of 2021 after a working vaccine is tested and ready for large-scale dissemination.
The difference between how the COVID-19 pandemic influences what people experience on any given day compared with how people assess their lives more broadly is also plain to see. The unprecedented worsening in daily emotions -- decreases in enjoyment and increases in worry and stress -- are likely explained by a compounding set of life-altering factors, including Americans' uncertainty about their physical and financial health in the near future, the pressures of required social isolation, and the chaos for parents attempting to manage work and childcare out of the home.
Special thanks to Sangeeta Agrawal, who contributed to this article.
Learn more about how the Gallup National Health and Well-Being Index works.
Learn more about how the Gallup Panel works.