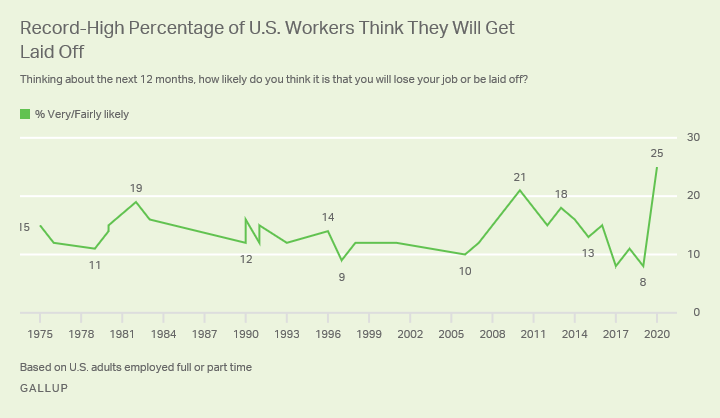
WASHINGTON, D.C. -- As the unemployment rate continues to rise sharply in the wake of the novel coronavirus, a record-high 25% of employed U.S. adults think they are likely to be laid off in the next year. This latest reading in Gallup's 45-year trend comes one year after it hit 8%, which matched the lowest level recorded.

The one-quarter of U.S. workers employed full or part time who think they are likely to lose their jobs in the next 12 months include 9% who say it is "very likely" and 16% "fairly likely." Meanwhile, 37% say this is "not too likely" and 38% "not at all likely."
The April 1-14 poll was conducted as more than 20 million U.S. workers have filed for unemployment benefits, and many more have been furloughed by their employers -- meaning they continue to receive benefits, though not pay. For this survey, Gallup counted workers who said they were furloughed as employed.
These abrupt changes in the economy have led Americans to be more fearful about losing their own job, as well as shaken their confidence in the U.S. economy and the job market more generally.
Few employed Americans predict that they would last a year (12%) or longer (12%) before experiencing significant hardship if they were to lose their jobs. Three-quarters say they would last less than a year, including 13% who could go only one week, 28% up to one month, and 34% no more than four months.
| Employed U.S. adults | |||||||||||||||||||||||||||||||||||||||||||||||||||||||||||||||||||||||||||||||||||||||||||||||||||
|---|---|---|---|---|---|---|---|---|---|---|---|---|---|---|---|---|---|---|---|---|---|---|---|---|---|---|---|---|---|---|---|---|---|---|---|---|---|---|---|---|---|---|---|---|---|---|---|---|---|---|---|---|---|---|---|---|---|---|---|---|---|---|---|---|---|---|---|---|---|---|---|---|---|---|---|---|---|---|---|---|---|---|---|---|---|---|---|---|---|---|---|---|---|---|---|---|---|---|---|
| % | |||||||||||||||||||||||||||||||||||||||||||||||||||||||||||||||||||||||||||||||||||||||||||||||||||
| Up to one week | 13 | ||||||||||||||||||||||||||||||||||||||||||||||||||||||||||||||||||||||||||||||||||||||||||||||||||
| Up to one month | 28 | ||||||||||||||||||||||||||||||||||||||||||||||||||||||||||||||||||||||||||||||||||||||||||||||||||
| Up to four months | 34 | ||||||||||||||||||||||||||||||||||||||||||||||||||||||||||||||||||||||||||||||||||||||||||||||||||
| Up to one year | 12 | ||||||||||||||||||||||||||||||||||||||||||||||||||||||||||||||||||||||||||||||||||||||||||||||||||
| More than one year | 12 | ||||||||||||||||||||||||||||||||||||||||||||||||||||||||||||||||||||||||||||||||||||||||||||||||||
| Based on U.S. adults employed full or part time | |||||||||||||||||||||||||||||||||||||||||||||||||||||||||||||||||||||||||||||||||||||||||||||||||||
| GALLUP, April 1-14, 2020 | |||||||||||||||||||||||||||||||||||||||||||||||||||||||||||||||||||||||||||||||||||||||||||||||||||
Gallup has tracked this measure periodically since 2001 and has not found much variation in the public's responses throughout the years, including the current levels.
View complete question responses and trends (PDF download).
Learn more about how the Gallup Poll Social Series works.


