Story Highlights
- 77% say election matters more than in previous years
- 85% of Democrats, 79% of Republicans, 69% of independents say it matters more
- Voter views of election importance tracked with voter turnout in past
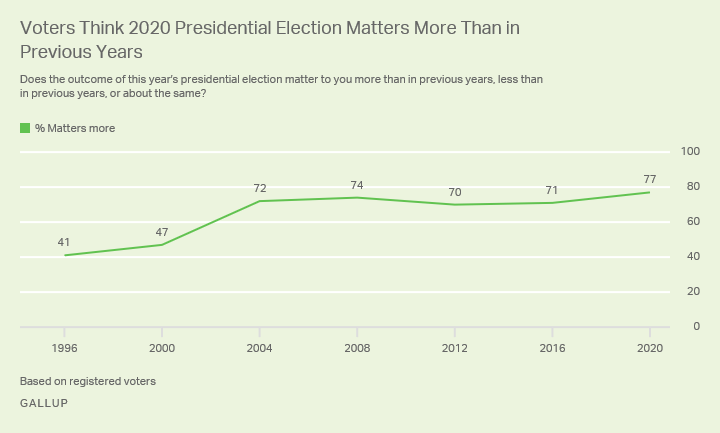
WASHINGTON, D.C. -- A record-high percentage of U.S. voters say the outcome of this year's election matters more to them than prior elections did. The 77% of registered voters holding this view is up six percentage points from 2016 and is the highest in Gallup's trend dating back to 1996.
While few voters (2%) say the election matters less than in the past, 21% think it matters about the same.

Line graph. Registered voters' belief that the outcome of this year's presidential election matters more than in previous years since 1996. It is currently 77%, the highest on record and up six points since 2016.
These findings, from a Sept. 14-28 poll, mark the seventh consecutive presidential election in which Gallup has tracked this measure. The previous six readings were taken closer to the election date, but this should not be of consequence given that more voters than ever in U.S. history are voting early this year, either in person or by mail as a result of the coronavirus pandemic.
Since 2004, at least seven in 10 voters have regarded each election as more consequential than those before it. However, far fewer voters considered the 1996 and 2000 elections as mattering more than the previous election, as 41% and 47%, respectively, said as much. This shift may have been a result of the 2000 election when the outcome of the election was ultimately decided by the U.S. Supreme Court after close vote totals in Florida necessitated a recount.
Partisans' Views of Election Depend on Which Party Is in Power
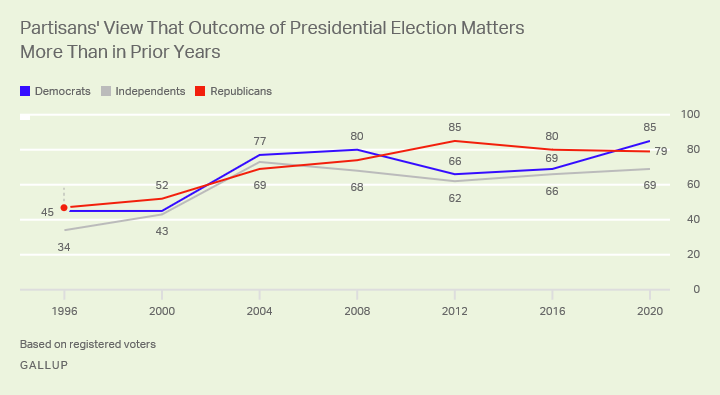
While broad majorities across the political spectrum say this year's election is more important, Democrats are slightly more likely than Republicans to say so -- 85% vs. 79%. Independents (69%) are less likely to say this year's election matters more, as is typically the case. Democrats' current reading is the highest on record for the party and is up 16 points from 2016 -- and it matches Republicans' views in 2012 when President Barack Obama was up for reelection. Republicans' views on the election are unchanged from 2016.

Line graph. Partisan registered voters' belief that the outcome of this year's presidential election matters more than in previous years since 1996. Currently, 85% of Democrats, 79% of Republicans and 69% of independents say this election matters more.
Partisans' views of how much each election mattered have varied based on the sitting president's party. That is, in every year that a Republican president was in the White House, Democrats were more likely than Republicans to say they thought the election mattered more than those prior. Likewise, each year the sitting president was a Democrat, Republicans were more likely to say the election mattered more.
| Democrats | Republicans | Advantage | Party of sitting president | ||||||||||||||||||||||||||||||||||||||||||||||||||||||||||||||||||||||||||||||||||||||||||||||||
|---|---|---|---|---|---|---|---|---|---|---|---|---|---|---|---|---|---|---|---|---|---|---|---|---|---|---|---|---|---|---|---|---|---|---|---|---|---|---|---|---|---|---|---|---|---|---|---|---|---|---|---|---|---|---|---|---|---|---|---|---|---|---|---|---|---|---|---|---|---|---|---|---|---|---|---|---|---|---|---|---|---|---|---|---|---|---|---|---|---|---|---|---|---|---|---|---|---|---|---|
| % | % | pct. pts. | |||||||||||||||||||||||||||||||||||||||||||||||||||||||||||||||||||||||||||||||||||||||||||||||||
| 2020 | 85 | 79 | D +6 | Republican | |||||||||||||||||||||||||||||||||||||||||||||||||||||||||||||||||||||||||||||||||||||||||||||||
| 2016 | 69 | 80 | R +11 | Democrat | |||||||||||||||||||||||||||||||||||||||||||||||||||||||||||||||||||||||||||||||||||||||||||||||
| 2012 | 66 | 85 | R +19 | Democrat | |||||||||||||||||||||||||||||||||||||||||||||||||||||||||||||||||||||||||||||||||||||||||||||||
| 2008 | 80 | 74 | D +6 | Republican | |||||||||||||||||||||||||||||||||||||||||||||||||||||||||||||||||||||||||||||||||||||||||||||||
| 2004 | 77 | 69 | D +8 | Republican | |||||||||||||||||||||||||||||||||||||||||||||||||||||||||||||||||||||||||||||||||||||||||||||||
| 2000 | 45 | 52 | R +7 | Democrat | |||||||||||||||||||||||||||||||||||||||||||||||||||||||||||||||||||||||||||||||||||||||||||||||
| 1996 | 45 | 47 | R +2 | Democrat | |||||||||||||||||||||||||||||||||||||||||||||||||||||||||||||||||||||||||||||||||||||||||||||||
| GALLUP | |||||||||||||||||||||||||||||||||||||||||||||||||||||||||||||||||||||||||||||||||||||||||||||||||||
Turnout Directly Linked to Voters' Belief Election Matters More
Voter turnout has historically followed the same trajectory as the measure tracking how much the election matters. The more intently the electorate has viewed the election as mattering more than prior years, the higher voter turnout has been.
The correlation between Americans' view that the election matters more and voter turnout has been 0.98 since 1996. This is on a scale from -1.0 to 1.0, where a score of 1.0 represents a perfect correlation -- meaning the two figures move at the same rate in the same direction. A score of zero would indicate no correlation, while a score of -1.0 would represent a perfect negative correlation -- meaning the figures move at the same rate in opposite directions.
| This election matters more | Voter turnout | ||||||||||||||||||||||||||||||||||||||||||||||||||||||||||||||||||||||||||||||||||||||||||||||||||
|---|---|---|---|---|---|---|---|---|---|---|---|---|---|---|---|---|---|---|---|---|---|---|---|---|---|---|---|---|---|---|---|---|---|---|---|---|---|---|---|---|---|---|---|---|---|---|---|---|---|---|---|---|---|---|---|---|---|---|---|---|---|---|---|---|---|---|---|---|---|---|---|---|---|---|---|---|---|---|---|---|---|---|---|---|---|---|---|---|---|---|---|---|---|---|---|---|---|---|---|
| % | % | ||||||||||||||||||||||||||||||||||||||||||||||||||||||||||||||||||||||||||||||||||||||||||||||||||
| 2016 | 71 | 60.1 | |||||||||||||||||||||||||||||||||||||||||||||||||||||||||||||||||||||||||||||||||||||||||||||||||
| 2012 | 70 | 58.6 | |||||||||||||||||||||||||||||||||||||||||||||||||||||||||||||||||||||||||||||||||||||||||||||||||
| 2008 | 74 | 61.6 | |||||||||||||||||||||||||||||||||||||||||||||||||||||||||||||||||||||||||||||||||||||||||||||||||
| 2004 | 72 | 60.1 | |||||||||||||||||||||||||||||||||||||||||||||||||||||||||||||||||||||||||||||||||||||||||||||||||
| 2000 | 47 | 54.2 | |||||||||||||||||||||||||||||||||||||||||||||||||||||||||||||||||||||||||||||||||||||||||||||||||
| 1996 | 41 | 51.7 | |||||||||||||||||||||||||||||||||||||||||||||||||||||||||||||||||||||||||||||||||||||||||||||||||
| GALLUP and U.S. Elections Project | |||||||||||||||||||||||||||||||||||||||||||||||||||||||||||||||||||||||||||||||||||||||||||||||||||
In 2008, when voter turnout was at its highest point since 1968 and 61.6% of eligible voters went to the polls, 74% of voters had said the election outcome mattered more to them.
Bottom Line
The 2020 election is unique given that, amid the coronavirus pandemic, early voting is already reaching record-high levels. While some election indicators suggest that this year might not be remarkable in terms of turnout, the latest reading on Gallup's 24-year measure tracking voters' view that the election matters more than in the past suggests that turnout in this year's election could be significantly higher than it has been in recent years. In fact, looking at this measure only, turnout would likely surpass the recent high of nearly 62% citizen participation in 2008.
View complete question responses and trends (PDF download).
Learn more about how the Gallup Poll Social Series works.


