Story Highlights
- Record-low favorability ratings for China (20%) and Russia (22%)
- Canada, Great Britain have highest favorability; Iran, North Korea lowest
- Palestinian Authority favorability rating at new 30% high
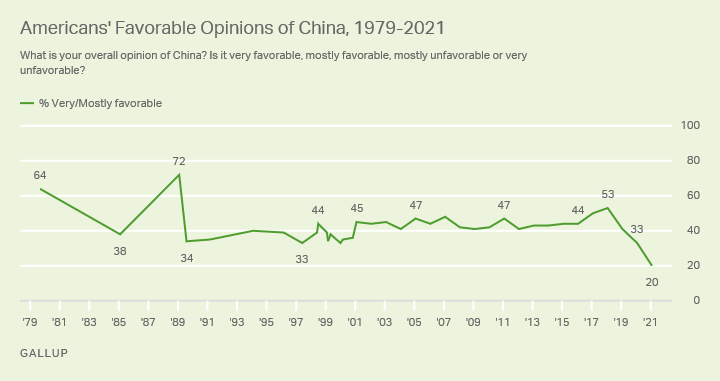
WASHINGTON, D.C. -- Americans' favorable ratings of China have plummeted to a record low 20%, following a 13-percentage point drop in favorability from 33% a year ago. This comes on the heels of last year's eight-point decline, measured after the coronavirus first spread in China but before it became a worldwide pandemic.

Line graph. Americans' combined very or mostly favorable ratings of China since 1979. Currently, 20% of Americans view China favorably, marking the lowest on record. Last year's 33% was tied with the previous low point. The highest on record was 72% in 1989, prior to the Tiananmen Square protests.
Last year's 33% favorability tied readings in 1997 and 2000 as the lowest in Gallup's trend dating back to 1979. It was also in line with a 34% favorable rating in August 1989 following the Chinese government's crackdown on protestors in Tiananmen Square.
The highest recorded by Gallup, 72%, came in the months before the Tiananmen Square incident. Favorability of China has only been at the majority level three times since 1979; 2018 was the last time this happened.
The latest ratings, from a Feb. 3-18 poll, were recorded mostly after President Joe Biden announced on Feb. 7 that he is prepared to compete with China, the world's second-largest economy, but that his approach will be different from his predecessor's. Since the poll, in a Feb. 20 speech, he went further, saying, "We have to push back against the Chinese government's abuses and coercion that undercut the foundations of the international economic system."
Partisans' ratings of China have all worsened since 2020, but Republicans' remains the lowest. Republicans' favorable rating fell 13 percentage points to 10%, Democrats' declined eight points to 27% and independents' is down 17 points to 22%.
| 2020 | 2021 | Change | |||||||||||||||||||||||||||||||||||||||||||||||||||||||||||||||||||||||||||||||||||||||||||||||||
|---|---|---|---|---|---|---|---|---|---|---|---|---|---|---|---|---|---|---|---|---|---|---|---|---|---|---|---|---|---|---|---|---|---|---|---|---|---|---|---|---|---|---|---|---|---|---|---|---|---|---|---|---|---|---|---|---|---|---|---|---|---|---|---|---|---|---|---|---|---|---|---|---|---|---|---|---|---|---|---|---|---|---|---|---|---|---|---|---|---|---|---|---|---|---|---|---|---|---|---|
| % | % | pct. pts. | |||||||||||||||||||||||||||||||||||||||||||||||||||||||||||||||||||||||||||||||||||||||||||||||||
| Republican | 23 | 10 | -13 | ||||||||||||||||||||||||||||||||||||||||||||||||||||||||||||||||||||||||||||||||||||||||||||||||
| Independent | 39 | 22 | -17 | ||||||||||||||||||||||||||||||||||||||||||||||||||||||||||||||||||||||||||||||||||||||||||||||||
| Democrat | 35 | 27 | -8 | ||||||||||||||||||||||||||||||||||||||||||||||||||||||||||||||||||||||||||||||||||||||||||||||||
| GALLUP | |||||||||||||||||||||||||||||||||||||||||||||||||||||||||||||||||||||||||||||||||||||||||||||||||||
Favorability of Allies and Competitors
Gallup's ratings of China are part of its annual update on Americans' views of major world countries. Of 17 other nations, Americans express the most favorable views of traditional allies, such as Canada and Great Britain, and the least favorable opinions of nations often at odds with the United States on the global stage, such as Iran and North Korea. Notably, most Americans continue to have unfavorable views of Iraq and Afghanistan, two nations that have been at the center of U.S. foreign policy for the past two decades.
| Very/Mostly favorable | Very/Mostly unfavorable | ||||||||||||||||||||||||||||||||||||||||||||||||||||||||||||||||||||||||||||||||||||||||||||||||||
|---|---|---|---|---|---|---|---|---|---|---|---|---|---|---|---|---|---|---|---|---|---|---|---|---|---|---|---|---|---|---|---|---|---|---|---|---|---|---|---|---|---|---|---|---|---|---|---|---|---|---|---|---|---|---|---|---|---|---|---|---|---|---|---|---|---|---|---|---|---|---|---|---|---|---|---|---|---|---|---|---|---|---|---|---|---|---|---|---|---|---|---|---|---|---|---|---|---|---|---|
| % | % | ||||||||||||||||||||||||||||||||||||||||||||||||||||||||||||||||||||||||||||||||||||||||||||||||||
| Canada | 92 | 6 | |||||||||||||||||||||||||||||||||||||||||||||||||||||||||||||||||||||||||||||||||||||||||||||||||
| Great Britain | 91 | 8 | |||||||||||||||||||||||||||||||||||||||||||||||||||||||||||||||||||||||||||||||||||||||||||||||||
| France | 87 | 12 | |||||||||||||||||||||||||||||||||||||||||||||||||||||||||||||||||||||||||||||||||||||||||||||||||
| Japan | 84 | 17 | |||||||||||||||||||||||||||||||||||||||||||||||||||||||||||||||||||||||||||||||||||||||||||||||||
| Germany | 84 | 15 | |||||||||||||||||||||||||||||||||||||||||||||||||||||||||||||||||||||||||||||||||||||||||||||||||
| India | 77 | 23 | |||||||||||||||||||||||||||||||||||||||||||||||||||||||||||||||||||||||||||||||||||||||||||||||||
| Israel | 75 | 23 | |||||||||||||||||||||||||||||||||||||||||||||||||||||||||||||||||||||||||||||||||||||||||||||||||
| Taiwan | 72 | 24 | |||||||||||||||||||||||||||||||||||||||||||||||||||||||||||||||||||||||||||||||||||||||||||||||||
| Mexico | 65 | 34 | |||||||||||||||||||||||||||||||||||||||||||||||||||||||||||||||||||||||||||||||||||||||||||||||||
| Egypt | 62 | 34 | |||||||||||||||||||||||||||||||||||||||||||||||||||||||||||||||||||||||||||||||||||||||||||||||||
| Cuba | 45 | 54 | |||||||||||||||||||||||||||||||||||||||||||||||||||||||||||||||||||||||||||||||||||||||||||||||||
| The Palestinian Authority | 30 | 65 | |||||||||||||||||||||||||||||||||||||||||||||||||||||||||||||||||||||||||||||||||||||||||||||||||
| Russia | 22 | 77 | |||||||||||||||||||||||||||||||||||||||||||||||||||||||||||||||||||||||||||||||||||||||||||||||||
| Afghanistan | 21 | 79 | |||||||||||||||||||||||||||||||||||||||||||||||||||||||||||||||||||||||||||||||||||||||||||||||||
| Iraq | 21 | 77 | |||||||||||||||||||||||||||||||||||||||||||||||||||||||||||||||||||||||||||||||||||||||||||||||||
| China | 20 | 79 | |||||||||||||||||||||||||||||||||||||||||||||||||||||||||||||||||||||||||||||||||||||||||||||||||
| Iran | 13 | 85 | |||||||||||||||||||||||||||||||||||||||||||||||||||||||||||||||||||||||||||||||||||||||||||||||||
| North Korea | 11 | 89 | |||||||||||||||||||||||||||||||||||||||||||||||||||||||||||||||||||||||||||||||||||||||||||||||||
| GALLUP, Feb. 3-18, 2021 | |||||||||||||||||||||||||||||||||||||||||||||||||||||||||||||||||||||||||||||||||||||||||||||||||||
Aside from China, there are noticeable changes in the favorable opinions of two other nations compared with last year:
-
The overall favorable view of Russia has dropped six points to a new low of 22%, and 77% now have an unfavorable opinion of the country. Republicans (25%) and independents (24%) hold a somewhat more favorable view of Russia than Democrats (16%). Since last year, Russia's image has declined among independents (down 12 points from 36%), whereas the views of Republicans and Democrats are unchanged.
-
Despite remaining relatively low, overall favorability of the Palestinian Authority rose to a new high of 30%, while 65% of Americans say they have an unfavorable view. Democrats are twice as likely as Republicans to view the Palestinian Authority favorably, 38% vs. 19%. Three in 10 independents hold a favorable opinion. Most of the increase in the past year has come from Republicans, only 9% of whom viewed the Palestinian governing body favorably last year.
Bottom Line
In a year upended by a pandemic first discovered in China, and perhaps the most widespread cyber-attack in the U.S. attributed to Russia by the U.S. intelligence community, both China and Russia have reached new low points in Americans' views. The findings also coincide with reports of increased hate crimes against Asian Americans across the United States, something Biden hopes to blunt by condemning anti-Asian speech in a recent executive order and directing the federal government to avoid such language in its operations.
China and Russia are among the more challenging nations for U.S. foreign policy under the Biden administration, as they were for the prior Obama and Trump administrations. But Biden's task may be made a bit easier if the current low favorable ratings mean Americans are unified in their perceptions of the challenges each country presents.
View complete question responses and trends (PDF download).
Learn more about how the Gallup Poll Social Series works.


