Story Highlights
- The percentage of U.S. adults classified as "thriving" drops to 55.1%
- Republicans and White Americans lead recent decline
- Significant daily worry and stress edge higher
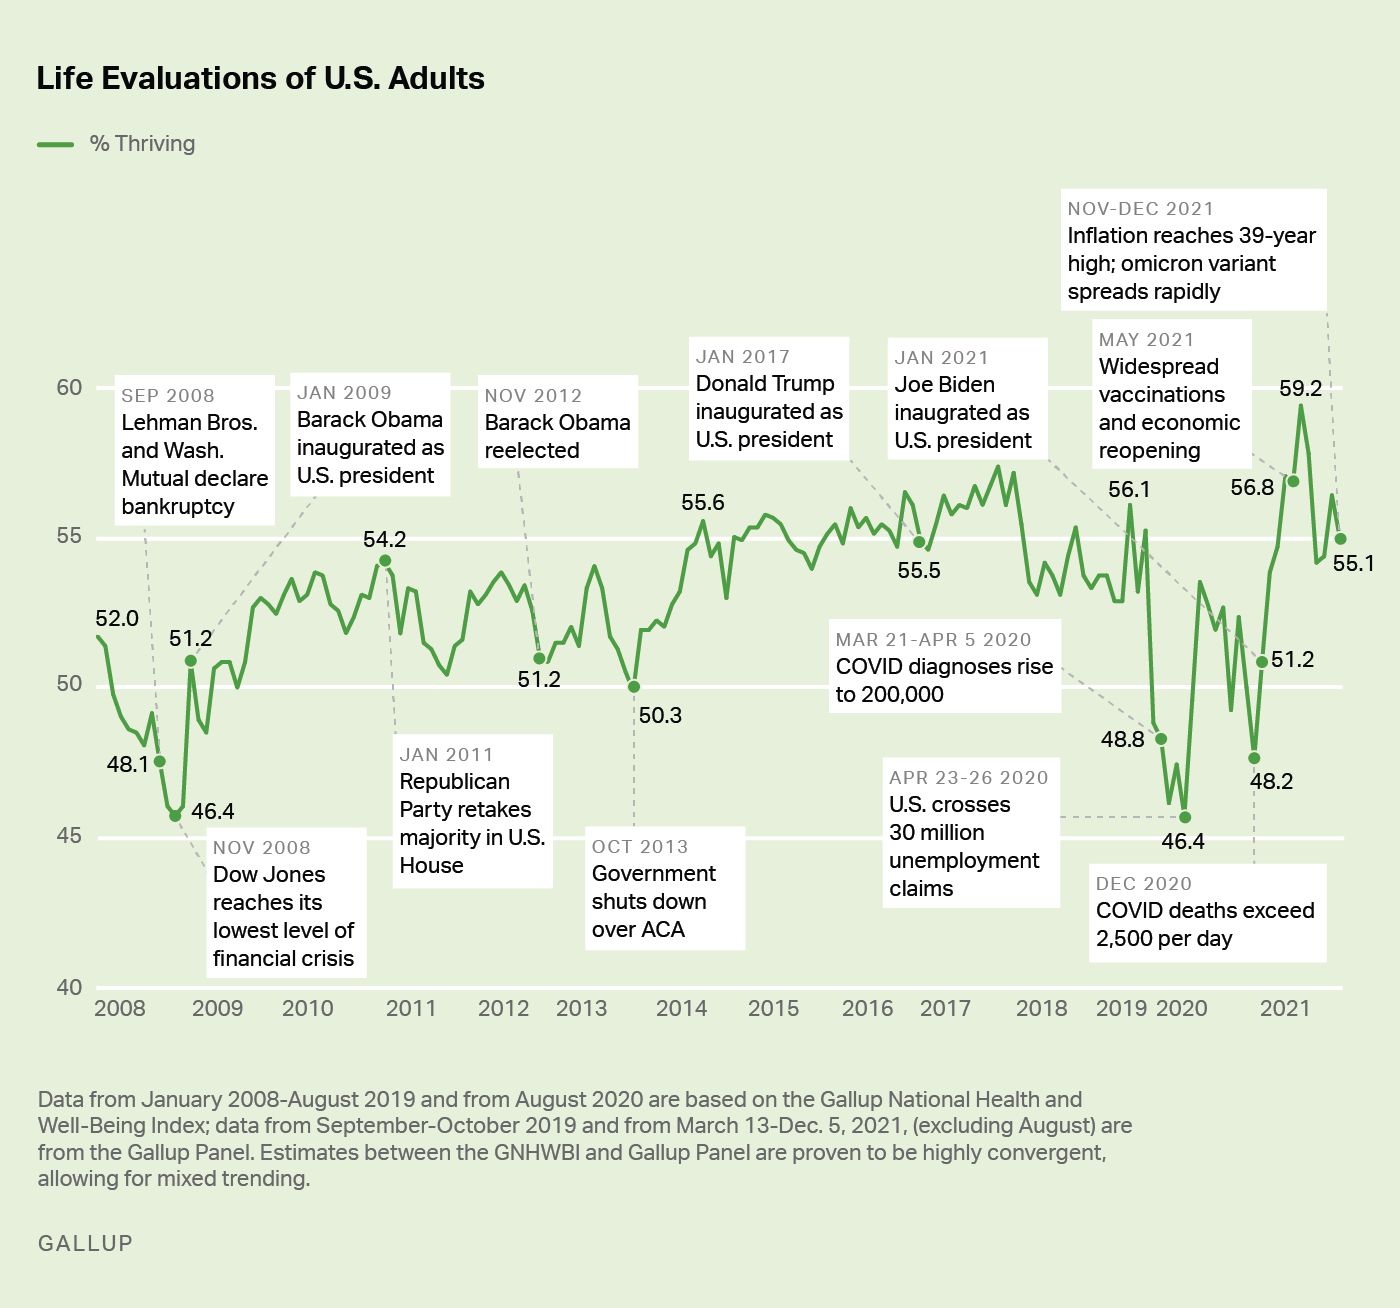
WASHINGTON, D.C. -- The percentage of Americans who evaluate their lives well enough to be considered "thriving" on Gallup's Life Evaluation Index was 55.1% in November-December, down 4.1 percentage points from the 14-year high of 59.2% measured in June. During the initial COVID-19 outbreak and economic shutdown, the thriving percentage plunged nearly 10 points to 46.4% in late April 2020, tying the record low measured during the Great Recession.

Line graph. 55.1% of Americans now rate their lives highly enough to be considered thriving. This is down from the 59.2% who did so in June of this year, which as a 14 year high in Gallup's trend.
The most recent results, from Nov. 29-Dec. 5, 2021, are based on 4,001 U.S. adults surveyed by web as part of the Gallup Panel, a probability-based, non-opt-in panel of about 115,000 adults across all 50 states and the District of Columbia. These interviews were conducted after the omicron variant had been detected in South Africa but before the highly contagious COVID-19 variant had become widespread in the U.S. Cases of the delta variant, however, were rapidly rising during this time frame.
The movement in Americans' life ratings over the past two years appears to be tied to the course of the COVID-19 pandemic, with optimism peaking in June when cases were low after vaccinations became widely available in the U.S. The summer surge in cases, and subsequent surges this winter, provide clear evidence that the hopes in early 2021 of the pandemic reaching an end were premature.
For its Life Evaluation Index, Gallup classifies Americans as "thriving," "struggling" or "suffering" according to how they rate their current and future lives on a ladder scale with steps numbered from zero to 10, based on the Cantril Self-Anchoring Striving Scale. Those who rate their current life a 7 or higher and their anticipated life in five years an 8 or higher are classified as thriving.
The percentage of Americans estimated to be "suffering" -- reporting a 4 or lower to both ladder items -- has remained steadily low throughout the pandemic and in line with pre-COVID estimates. In November-December, 3.7% of respondents were classified as suffering, compared with 3.4% in June and 3.6% in January 2021.
The remaining 41.2% of Americans who do not rate their lives well enough to be considered thriving or poorly enough to be considered suffering are categorized as "struggling" by Gallup.
White Adults, Republicans Lead Drop in Thriving in Second Half of 2021
The substantial rise of the "thriving" percentage in the first half of 2021 (and the subsequent decline over its second half) masks opposing patterns among political groups.
- From October 2020 to June 2021, Democrats' wellbeing improved from 42.4% to 58.1%, an increase of 15.7 points over the eight-month period.
- Republicans slid 5.2 points to 64.7% from October to June.
- Independents' wellbeing improved by 7.1 points in the same period.
Democrats were, thus, by far the primary source of the overall improvement of the "thriving" percentage between October 2020 and the record-high estimate of June 2021.
In the half-year since, the overall U.S. "thriving" decline is mostly a function of further erosion among Republicans (down 6.6 additional points), with Democrats and independents also down but remaining inside the statistical margins of error.
Among the major racial/ethnic groups, White, Black and Hispanic adults all improved by roughly the same degree between October 2020 and June 2021 -- but since that time, White adults are down by 5.1 points, a statistically significant decline.
| Oct 2020 |
Jun 2021 |
Nov-Dec 2021 |
Change: Oct 2020 to Jun 2021 |
Change: Jun 2021 to Nov-Dec 2021 |
|
|---|---|---|---|---|---|
| % | % | % | pct. pts. | pct. pts. | |
| U.S. adults | 52.6 | 59.2 | 55.1 | +6.6* | -4.1* |
| Political identity: | |||||
| Democrats | 42.4 | 58.1 | 55.3 | +15.7* | -2.8 |
| Independents | 48.7 | 55.8 | 52.0 | +7.1* | -3.8 |
| Republicans | 69.9 | 64.7 | 58.1 | -5.2* | -6.6* |
| Race/Ethnicity: | |||||
| White adults | 52.7 | 59.1 | 54.0 | +6.4* | -5.1* |
| Black adults | 54.2 | 60.5 | 57.2 | +6.3 | -3.3 |
| Hispanic adults | 52.4 | 60.2 | 58.7 | +7.8* | -1.5 |
| * = Statistically significant change (p<.05); Field periods: Oct. 19-Nov. 1, 2020 (N=2,963); June 14-20, 2021 (N=4,820); Nov. 29-Dec. 5, 2021 (N=4,001) | |||||
| Gallup | |||||
Daily Stress, Worry Edge Higher Since July's Pandemic Low
In addition to general life ratings, Gallup tracks whether Americans experience significant levels of specific emotions, including stress and worry, in their daily life.
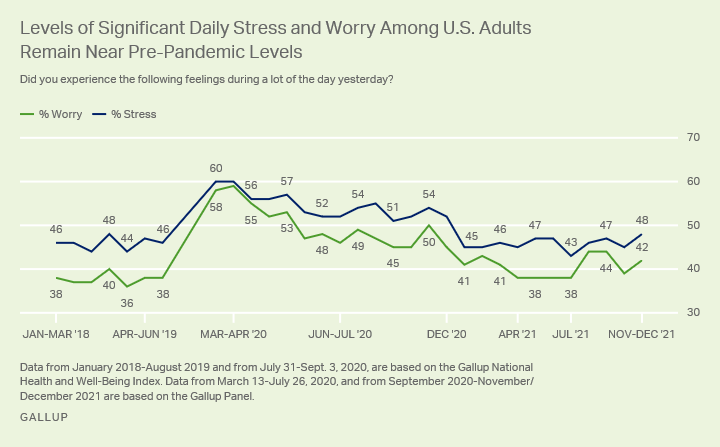
The percentages of people who reported experiencing stress and worry "a lot of the day yesterday" showed unprecedented increases in early March 2020, with stress rising 14 points to 60% and worry rising 20 points to 58%. These spikes were about four times greater than the previous largest increases Gallup measured over the course of 2008 as a result of the Great Recession.
Reports of experiencing these two emotions subsequently fell to pre-pandemic levels by April 2021, but estimates have edged higher since that time. After easing to 43% in July, daily stress was experienced by 48% of adults in November-December, while the rate of daily worry is now estimated at 42%, slightly higher than the 38% measured across four successive months from April through July.

Line graph. The percentages of Americans who reported feeling stress or worry a lot of the previous day. 48% of Americans reported feeling stress a lot of the previous day in the Nov-Dec, 2021 survey, while 42% of the U.S. public reported feeling worry.
Implications
Since reaching a record high in June 2021, a time when many thought the end of the COVID-19 pandemic was near, the subsequent decline in the percentage of Americans classified as thriving has occurred alongside the worsening of several other key indicators of wellbeing. Arguably the most important is the rapid summer spread of the delta variant beginning in July followed by a winter surge that has been characterized initially by rising cases of delta followed by the omicron variant, which has quickly displaced delta in the population. During this time, the average daily confirmed new cases of COVID-19 rose from around 12,000 per day in June to 150,000 and 120,000 cases, respectively, in September and early December. The arrival of the initial SARS-CoV-2 coronavirus in 2020 -- and the ensuing economic shutdown -- resulted in an unprecedented decline of nearly 10 percentage points in the "thriving" rate by April 2020, making the subsequent revitalization of COVID-19 since July a probable factor in the latest decline in wellbeing. That new daily cases have since rapidly shot past 700,000 in January bodes poorly for U.S. "thriving" rates moving into early 2022, although hospitalizations and deaths are well below previous rates relative to the new case counts.
Economic factors are also likely playing a prominent role. Despite a 2.8-point decline in the unemployment rate over the course of 2021 -- representing 4.5 million fewer unemployed persons -- other aspects of the economy appear to be driving overall public sentiment in a negative direction. In December, for example, the U.S. Bureau of Labor Statistics released its Consumer Price Index Summary for the month of November, showing a 6.8% increase over the prior 12 months, a 39-year high. Dovetailing with these results is the steady worsening of Gallup's Economic Confidence Index, which in December tied a pandemic low of -33, last measured in April 2020. These effects may also be manifesting themselves among Americans in practical terms, including increasing reports of care and medicine avoidance due to an inability to pay.
Politics can also factor into Americans' changing life ratings, particularly in the aftermath of a U.S. political election. But with Republicans' and Democrats' opposing reactions partially canceling themselves out, the public's life ratings as a whole are likely less affected by the election than by changing patterns in the pandemic or the economy.
To stay up to date with the latest Gallup News insights and updates, follow us on Twitter.
Learn more about how the Gallup National Health and Well-Being Index works.
Learn more about how the Gallup Panel works.


