
For most of the past century, people have used the growth of a single number -- Gross Domestic Product (GDP) -- to gauge a society's progress. While this single number is easy for the public, policymakers and the media to digest, it focuses solely on monetary wellbeing and doesn't tell us everything. It fails to take into account other important aspects of people's lives, including their health and education, and neglects key social and external negative influences such as crime and pollution.
For this reason, the European Commission developed the European Union's regional Social Progress Index (EU-SPI) to take discussions "beyond GDP" in European regions. Because it excludes economic indicators and focuses solely on social and environmental factors, the EU-SPI offers a directly comparable metric of social progress across regions in Europe.
Results From the 2020 EU-SPI
The European Commission first published the index in 2016 and released the second, expanded edition of the index in late 2020. The EU-SPI measures social progress on three dimensions -- basic human needs, foundations of wellbeing and opportunity. Each of these dimensions breaks down further into four components, based on a total of 55 indicators, with one in four coming from Gallup's World Poll.
All the EU-SPI scores are calculated based on a 0-100 scale, with 0 meaning the worst performance and 100 the best, ideal performance. This scale is determined by identifying the best and worst global (possible) performance on each indicator by any region in Europe. The EU performs well on basic human needs, with an average score of 80 out of 100, but its performance on the other dimensions progressively deteriorates, with scores of 64 out of 100 and 58 out of 100 on the foundations of wellbeing and opportunity dimensions, respectively.
| Basic human needs | Foundations of wellbeing | Opportunity | |||||||||||||||||||||||||||||||||||||||||||||||||||||||||||||||||||||||||||||||||||||||||||||||||
|---|---|---|---|---|---|---|---|---|---|---|---|---|---|---|---|---|---|---|---|---|---|---|---|---|---|---|---|---|---|---|---|---|---|---|---|---|---|---|---|---|---|---|---|---|---|---|---|---|---|---|---|---|---|---|---|---|---|---|---|---|---|---|---|---|---|---|---|---|---|---|---|---|---|---|---|---|---|---|---|---|---|---|---|---|---|---|---|---|---|---|---|---|---|---|---|---|---|---|---|
| Nutrition and basic medical care | Access to basic knowledge | Personal rights | |||||||||||||||||||||||||||||||||||||||||||||||||||||||||||||||||||||||||||||||||||||||||||||||||
| Water and sanitation | Access to information and communication | Personal freedom and choice | |||||||||||||||||||||||||||||||||||||||||||||||||||||||||||||||||||||||||||||||||||||||||||||||||
| Shelter | Health and wellness | Tolerance and inclusion | |||||||||||||||||||||||||||||||||||||||||||||||||||||||||||||||||||||||||||||||||||||||||||||||||
| Personal security | Environmental quality | Access to advanced education | |||||||||||||||||||||||||||||||||||||||||||||||||||||||||||||||||||||||||||||||||||||||||||||||||
| 2020 EU-SPI | |||||||||||||||||||||||||||||||||||||||||||||||||||||||||||||||||||||||||||||||||||||||||||||||||||
The 2020 index reveals social disparities that vary greatly both across regions and across different aspects of social progress. Nordic countries perform well on the index, while Southeastern countries lag behind. The top 10 regions are Swedish, Finnish or Danish. The region of Övre Norrland in northern Sweden is the most socially developed in the EU for the second time since 2016.
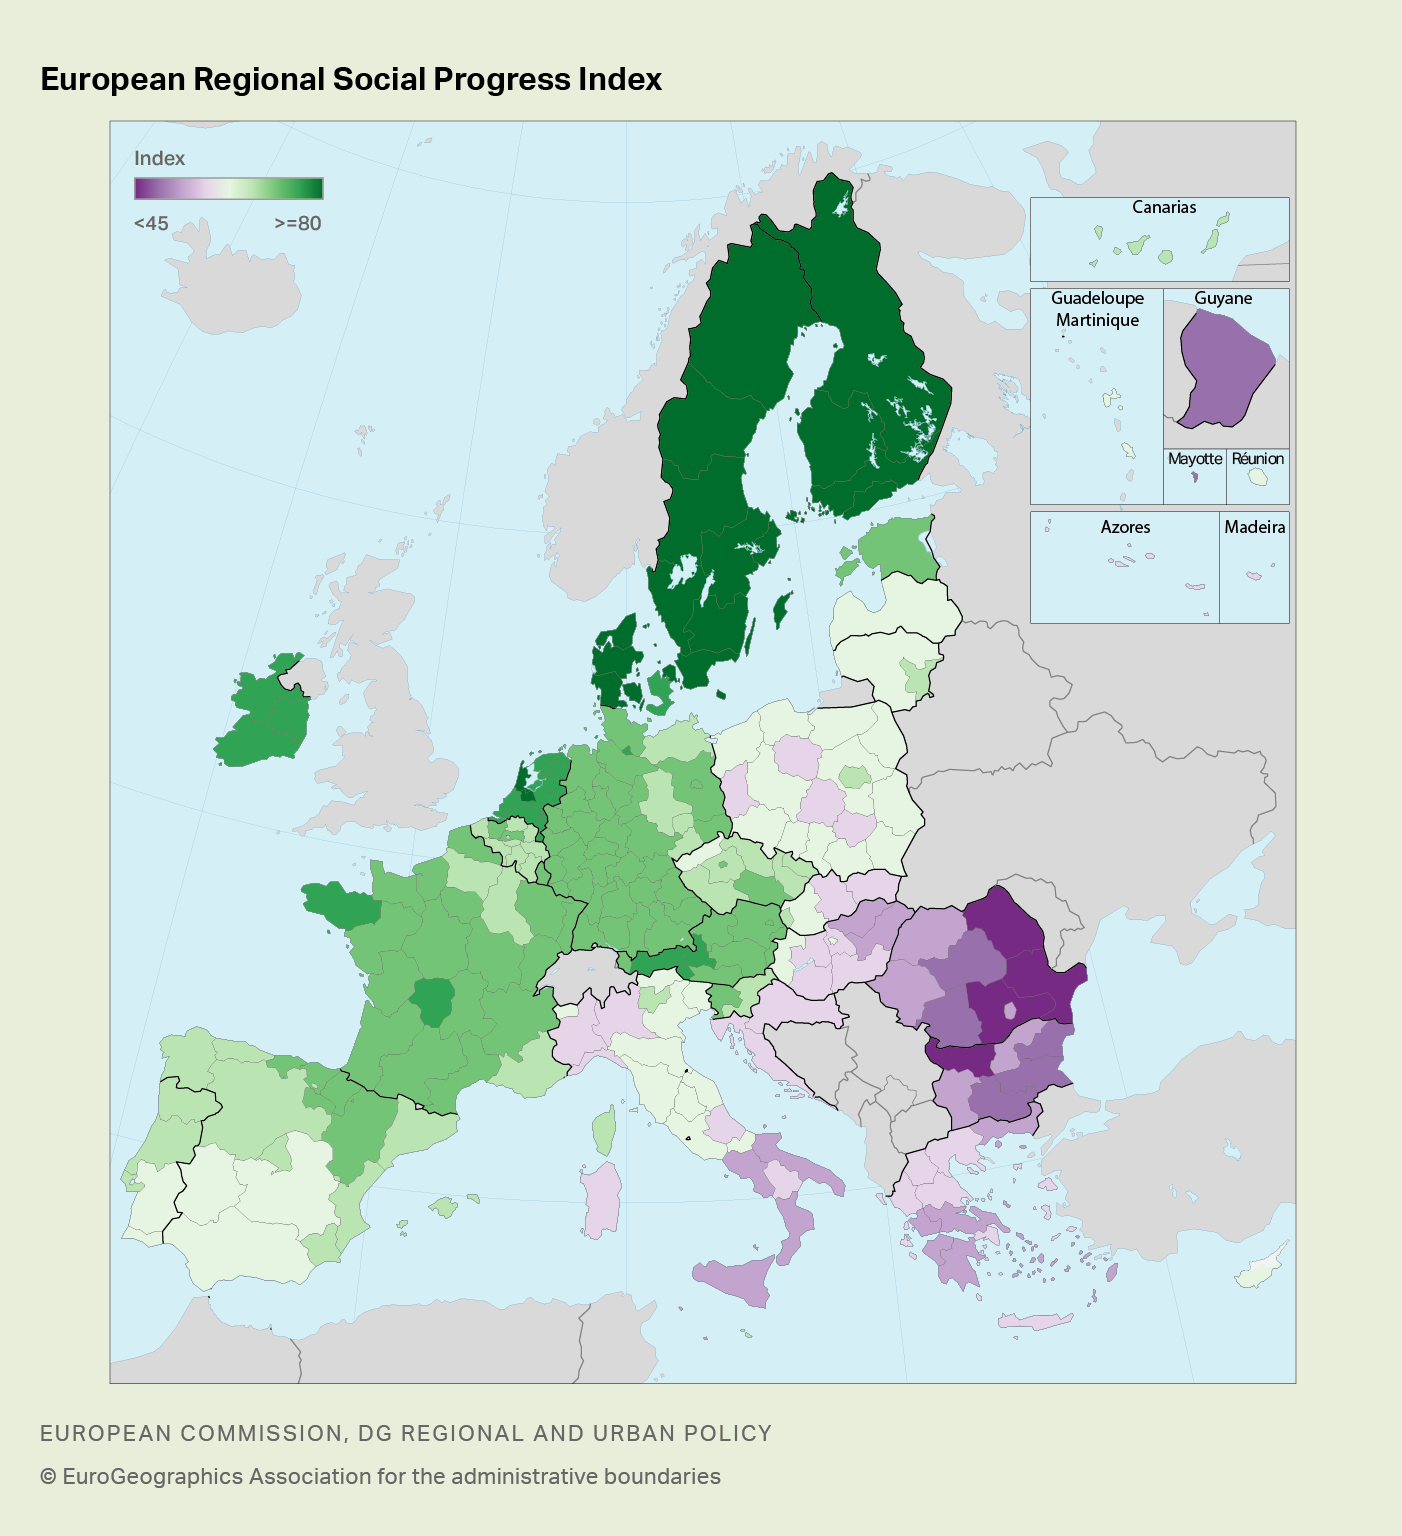
Heat map. All the European Union's regional Social Progress Index scores are calculated based on a 0-100 scale, with 0 meaning the worst performance and 100 the best, ideal performance. This scale is determined by identifying the best and worst global (possible) performance on each indicator by any region in Europe.
The fact that a sparsely populated territory in northern Sweden is the most socially advanced in the EU demonstrates that social progress can happen outside of cities. Living in a metropolitan area is not always a guarantee of social progress. Only 10 capital-city regions score better than the rest of the country and, notably, Brussels, Paris, Berlin and Madrid are not the top performers in their countries.
Metro areas start making a difference on the opportunity dimension, where they score at the top in most countries. This dimension includes indicators describing subtle factors of social progress like corruption in public institutions, tolerance toward minorities and gender equality.
Many of these indicators are from Gallup's World Poll and reveal high regional variation, with some regions performing very well and others quite poorly. The opportunity dimension describes a society as "developed" if it is inclusive and tolerant. These factors are harder to improve because they are linked to societal attitudes and people's trust ("the soft is the hard").
Relatedly, when it comes to quality of life, it is clear that GDP alone is not enough to measure wellbeing. While GDP and the 2020 EU-SPI are positively related, the richest regions are not necessarily the top performers in social progress, and the poorest regions are not always in last place. For example, the Paris region has a GDP per capita that is almost 80% higher than the EU average, yet its score on social progress is 71 out of 100, relatively far from the best.
Implications
The EU-SPI helps facilitate comparisons and benchmarking across the EU on a wide range of criteria that help policymakers and stakeholders assess a region's strong and weak points on purely social and environmental aspects. Many of these aspects are at the heart of the initiatives supported by European public investment in areas like health, education, water and waste, access to information and communication technologies, and energy efficiency.
Monitoring the regional performance on the various EU-SPI components helps policymakers to plan the best policy mix, target resources on the most problematic areas and fix measurable objectives. With its region's scorecards and peer region analysis, regions can use the EU-SPI to compare themselves with others, find regions achieving similar levels of social progress, and learn from good practices by focusing on each aspect included in the index.
Discover the EU-SPI and navigate through a series of interactive web tools that enable users to see how their region performs.