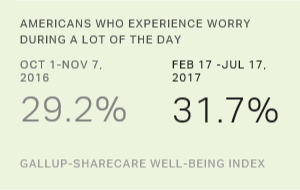
Americans reported an increase in negative emotions after the U.S. presidential election. All major racial subgroups were more likely to report daily worry over the past eight months, even after controlling for key factors like income and partisanship. In addition to a rise in worry, Hispanics also were more likely to experience daily stress after the election.
| % Worry | % Stress | ||||||||||||||||||||||||||||||||||||||||||||||||||||||||||||||||||||||||||||||||||||||||||||||||||
|---|---|---|---|---|---|---|---|---|---|---|---|---|---|---|---|---|---|---|---|---|---|---|---|---|---|---|---|---|---|---|---|---|---|---|---|---|---|---|---|---|---|---|---|---|---|---|---|---|---|---|---|---|---|---|---|---|---|---|---|---|---|---|---|---|---|---|---|---|---|---|---|---|---|---|---|---|---|---|---|---|---|---|---|---|---|---|---|---|---|---|---|---|---|---|---|---|---|---|---|
| Hispanic | White | Black | Hispanic | White | Black | ||||||||||||||||||||||||||||||||||||||||||||||||||||||||||||||||||||||||||||||||||||||||||||||
| June 1-Nov. 8, 2016 | 26.6 | 31.6 | 22.1 | 32.9 | 45.2 | 30.8 | |||||||||||||||||||||||||||||||||||||||||||||||||||||||||||||||||||||||||||||||||||||||||||||
| Nov. 9, 2016-June 30, 2017 | 29.5 | 34.1 | 24.5 | 35.4 | 45.6 | 31.9 | |||||||||||||||||||||||||||||||||||||||||||||||||||||||||||||||||||||||||||||||||||||||||||||
| Difference (pct. pts.) | +2.9 | +2.5 | +2.4 | +2.5 | +0.4 | +1.1 | |||||||||||||||||||||||||||||||||||||||||||||||||||||||||||||||||||||||||||||||||||||||||||||
| Gallup-Sharecare Well-Being Index | |||||||||||||||||||||||||||||||||||||||||||||||||||||||||||||||||||||||||||||||||||||||||||||||||||
However, the negative effects of the election on Hispanics' worry and stress do not appear to be uniform across the entire community. Respondents who took the Gallup-Sharecare Well-Being Index survey in Spanish registered the sharpest decline in emotional well-being. Holding other factors constant, the probability these respondents said they experienced worry yesterday increased 5.8 percentage points while stress increased 6.6 percentage points. Worry and stress for Hispanics interviewed in English remained roughly the same.
This difference aligns with research suggesting the recent presidential election constituted a dramatic societal event disproportionately affecting the health of individuals who perceived their community as a target of increased hostility or discrimination.
| % Worry | % Stress | ||||||||||||||||||||||||||||||||||||||||||||||||||||||||||||||||||||||||||||||||||||||||||||||||||
|---|---|---|---|---|---|---|---|---|---|---|---|---|---|---|---|---|---|---|---|---|---|---|---|---|---|---|---|---|---|---|---|---|---|---|---|---|---|---|---|---|---|---|---|---|---|---|---|---|---|---|---|---|---|---|---|---|---|---|---|---|---|---|---|---|---|---|---|---|---|---|---|---|---|---|---|---|---|---|---|---|---|---|---|---|---|---|---|---|---|---|---|---|---|---|---|---|---|---|---|
| Hispanics interviewed in Spanish | Hispanics interviewed in English | Hispanics interviewed in Spanish | Hispanics interviewed in English | ||||||||||||||||||||||||||||||||||||||||||||||||||||||||||||||||||||||||||||||||||||||||||||||||
| June 1-Nov. 8, 2016 | 23.8 | 28.3 | 22.4 | 38.8 | |||||||||||||||||||||||||||||||||||||||||||||||||||||||||||||||||||||||||||||||||||||||||||||||
| Nov. 9, 2016-June 30, 2017 | 29.6 | 29.3 | 29.0 | 38.2 | |||||||||||||||||||||||||||||||||||||||||||||||||||||||||||||||||||||||||||||||||||||||||||||||
| Difference (pct. pts.) | +5.8 | +1.0 | +6.6 | -0.6 | |||||||||||||||||||||||||||||||||||||||||||||||||||||||||||||||||||||||||||||||||||||||||||||||
| Gallup-Sharecare Well-Being Index | |||||||||||||||||||||||||||||||||||||||||||||||||||||||||||||||||||||||||||||||||||||||||||||||||||
These data were collected via the Gallup-Sharecare Well-Being Index from June 1, 2016-June 30, 2017. To measure stress and worry, Gallup and Sharecare ask U.S. adults whether they "experienced worry [stress] a lot of the day yesterday." Importantly, the Gallup-Sharecare Well-Being Index does not include political questions that could prime respondents to answer questions about their health and well-being in political terms.
Gallup interviews respondents in Spanish if the respondent is unable to complete the interview in English or if the respondent explicitly requests a Spanish-language interviewer. Thus, the sample of Hispanics interviewed in Spanish is not representative of all Spanish-speaking Hispanics in the U.S., but rather a group of those reached on the phone who had difficulty completing the survey in English.
Demographic and attitudinal data suggest the two groups are proxies for different Hispanic populations living in the U.S.
Separate Gallup research conducted in 2016 indicates that roughly nine in 10 Hispanics interviewed in Spanish were born in another country whereas more than eight in 10 interviewed in English are U.S. born. According to the Pew Research Center, approximately three in 10 foreign-born Hispanics are lawful permanent residents, and about four in 10 are unauthorized immigrants.
| Interviewed in Spanish | Interviewed in English | |||||||||||||||||||||||||||||||||||||||||||||||||||||||||||||||||||||||||||||||||||||||||||||||||||
|---|---|---|---|---|---|---|---|---|---|---|---|---|---|---|---|---|---|---|---|---|---|---|---|---|---|---|---|---|---|---|---|---|---|---|---|---|---|---|---|---|---|---|---|---|---|---|---|---|---|---|---|---|---|---|---|---|---|---|---|---|---|---|---|---|---|---|---|---|---|---|---|---|---|---|---|---|---|---|---|---|---|---|---|---|---|---|---|---|---|---|---|---|---|---|---|---|---|---|---|---|
| % | % | |||||||||||||||||||||||||||||||||||||||||||||||||||||||||||||||||||||||||||||||||||||||||||||||||||
| Education | ||||||||||||||||||||||||||||||||||||||||||||||||||||||||||||||||||||||||||||||||||||||||||||||||||||
| High school or less | 87.5 | 45.2 | ||||||||||||||||||||||||||||||||||||||||||||||||||||||||||||||||||||||||||||||||||||||||||||||||||
| Some college and vocational | 9.1 | 32.9 | ||||||||||||||||||||||||||||||||||||||||||||||||||||||||||||||||||||||||||||||||||||||||||||||||||
| College grad and above | 3.4 | 21.9 | ||||||||||||||||||||||||||||||||||||||||||||||||||||||||||||||||||||||||||||||||||||||||||||||||||
| Income | ||||||||||||||||||||||||||||||||||||||||||||||||||||||||||||||||||||||||||||||||||||||||||||||||||||
| Less than $36K | 86.5 | 42.8 | ||||||||||||||||||||||||||||||||||||||||||||||||||||||||||||||||||||||||||||||||||||||||||||||||||
| $36K to $90K | 12.7 | 38.7 | ||||||||||||||||||||||||||||||||||||||||||||||||||||||||||||||||||||||||||||||||||||||||||||||||||
| $90K and above | 0.8 | 18.5 | ||||||||||||||||||||||||||||||||||||||||||||||||||||||||||||||||||||||||||||||||||||||||||||||||||
| Age | ||||||||||||||||||||||||||||||||||||||||||||||||||||||||||||||||||||||||||||||||||||||||||||||||||||
| 18 to 29 | 20.7 | 42.0 | ||||||||||||||||||||||||||||||||||||||||||||||||||||||||||||||||||||||||||||||||||||||||||||||||||
| 30 to 44 | 42.5 | 28.0 | ||||||||||||||||||||||||||||||||||||||||||||||||||||||||||||||||||||||||||||||||||||||||||||||||||
| 45 to 64 | 28.8 | 23.4 | ||||||||||||||||||||||||||||||||||||||||||||||||||||||||||||||||||||||||||||||||||||||||||||||||||
| 65+ | 8.0 | 6.6 | ||||||||||||||||||||||||||||||||||||||||||||||||||||||||||||||||||||||||||||||||||||||||||||||||||
| Born in another country† | ||||||||||||||||||||||||||||||||||||||||||||||||||||||||||||||||||||||||||||||||||||||||||||||||||||
| Born in U.S. | 6.7 | 82.8 | ||||||||||||||||||||||||||||||||||||||||||||||||||||||||||||||||||||||||||||||||||||||||||||||||||
| Born in another country | 92.7 | 17.2 | ||||||||||||||||||||||||||||||||||||||||||||||||||||||||||||||||||||||||||||||||||||||||||||||||||
| Either parent born in another country† | ||||||||||||||||||||||||||||||||||||||||||||||||||||||||||||||||||||||||||||||||||||||||||||||||||||
| One or both born outside of U.S. | 96.2 | 42.1 | ||||||||||||||||||||||||||||||||||||||||||||||||||||||||||||||||||||||||||||||||||||||||||||||||||
| Both born in the U.S. | 3.8 | 55.8 | ||||||||||||||||||||||||||||||||||||||||||||||||||||||||||||||||||||||||||||||||||||||||||||||||||
| Gallup-Sharecare Well-Being Index; †Gallup Survey on Minority Rights and Relations 2016 | ||||||||||||||||||||||||||||||||||||||||||||||||||||||||||||||||||||||||||||||||||||||||||||||||||||
The 2016 research also helps shed light on other differences between the two groups of Hispanics. Compared with Hispanics interviewed in English, those interviewed in Spanish were roughly twice as likely to earn less than $36,000 (86.5%) and achieve a high school degree or less (87.5%). English speakers were generally younger, and the majority were third-generation immigrants or more.
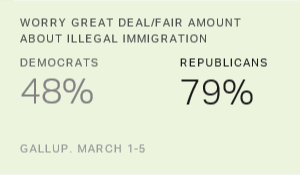
Attitudes toward salient political issues also differed among these groups. In the 2016 Gallup survey, Hispanics interviewed in Spanish expressed more dissatisfaction with how immigrants (78.3%) and Hispanics (63.4%) in society are treated than Hispanics interviewed in English, who stood at 59.7% and 46.5%, respectively. Similarly, 67.1% of Hispanics interviewed in Spanish in 2016 said they were very concerned someone they knew living in the U.S. illegally would be deported back to their home country if Donald Trump were elected president; only 39.8% of English speakers were equally concerned.
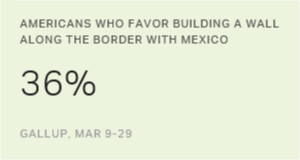
This previous research on Hispanics who were interviewed in Spanish helps suggest reasons for the increase in worry and stress in that group since the election, namely the recent uptick in heated rhetoric surrounding the immigration debate and renewed uncertainty on policy toward the illegal immigrant population.
Finding a New Normal Under Trump?
The increase in stress and worry among some Hispanics may prove temporary. New Gallup and Sharecare research shows daily worry among U.S. adults has declined but still exceeds pre-election levels. This suggests Americans may be gradually adjusting to the novel political landscape.
For Spanish-interviewed Hispanics, daily worry has dipped after Trump's inauguration but remains higher than before his election. In contrast, the increased probability among Hispanics interviewed in Spanish to experience daily stress does not show a similar decline.
| % Worry | % Stress | ||||||||||||||||||||||||||||||||||||||||||||||||||||||||||||||||||||||||||||||||||||||||||||||||||
|---|---|---|---|---|---|---|---|---|---|---|---|---|---|---|---|---|---|---|---|---|---|---|---|---|---|---|---|---|---|---|---|---|---|---|---|---|---|---|---|---|---|---|---|---|---|---|---|---|---|---|---|---|---|---|---|---|---|---|---|---|---|---|---|---|---|---|---|---|---|---|---|---|---|---|---|---|---|---|---|---|---|---|---|---|---|---|---|---|---|---|---|---|---|---|---|---|---|---|---|
| Spanish-language Hispanic | English-language Hispanic | White | Black | Spanish-language Hispanic | English-language Hispanic | White | Black | ||||||||||||||||||||||||||||||||||||||||||||||||||||||||||||||||||||||||||||||||||||||||||||
| Aug. 1-Nov. 8, 2016 | 23.2 | 28.7 | 32.0 | 22.2 | 21.8 | 38.7 | 45.4 | 30.9 | |||||||||||||||||||||||||||||||||||||||||||||||||||||||||||||||||||||||||||||||||||||||||||
| Nov. 9, 2016-Jan. 19, 2017 | 31.4* | 28.6 | 32.8 | 22.9 | 28.7* | 38.2 | 45.0 | 30.0 | |||||||||||||||||||||||||||||||||||||||||||||||||||||||||||||||||||||||||||||||||||||||||||
| Jan. 20-March 30, 2017 | 30.3* | 29.7 | 35.3* | 24.4 | 28.7* | 38.9 | 46.1 | 31.3 | |||||||||||||||||||||||||||||||||||||||||||||||||||||||||||||||||||||||||||||||||||||||||||
| April 1-June 30, 2017 | 27.8* | 29.3 | 34.2* | 25.4* | 30.0* | 37.4 | 46.0 | 33.0 | |||||||||||||||||||||||||||||||||||||||||||||||||||||||||||||||||||||||||||||||||||||||||||
| * statistically significant at the p<0.05 level compared with the first period | |||||||||||||||||||||||||||||||||||||||||||||||||||||||||||||||||||||||||||||||||||||||||||||||||||
| Gallup-Sharecare Well-Being Index | |||||||||||||||||||||||||||||||||||||||||||||||||||||||||||||||||||||||||||||||||||||||||||||||||||
Bottom Line
Trump's election affected segments of the population differently. Hispanics whom Gallup interviewed in Spanish reported a greater increase in daily worry and stress than Hispanics interviewed in English. Six months into the new administration, this daily stress among Hispanics interviewed in Spanish does not appear to be moving back toward pre-election levels.
The heated rhetoric surrounding the immigration debate likely increases this sense of societal isolation and vulnerability. Uncertainty over the status of Deferred Action for Childhood Arrivals (DACA), the legal status of sanctuary cities, and modified Immigration and Customs Enforcement (ICE) policies also may be adding to increased worry and stress.

Gallup Analytics
Subscribe to our online platform and access nearly a century of primary data.
Survey Methods
Results are based on telephone interviews conducted June 1, 2016-June 30, 2017, as part of the Gallup-Sharecare Well-Being Index survey, with a random sample of 123,272 adults, aged 18 and older, living in all 50 U.S. states and the District of Columbia.
| Sample Size | Margin of Error | |||||||||||||||||||||||||||||||||||||||||||||||||||||||||||||||||||||||||||||||||||||||||||||||||||
|---|---|---|---|---|---|---|---|---|---|---|---|---|---|---|---|---|---|---|---|---|---|---|---|---|---|---|---|---|---|---|---|---|---|---|---|---|---|---|---|---|---|---|---|---|---|---|---|---|---|---|---|---|---|---|---|---|---|---|---|---|---|---|---|---|---|---|---|---|---|---|---|---|---|---|---|---|---|---|---|---|---|---|---|---|---|---|---|---|---|---|---|---|---|---|---|---|---|---|---|---|
| n | ± (pct. pts.) | |||||||||||||||||||||||||||||||||||||||||||||||||||||||||||||||||||||||||||||||||||||||||||||||||||
| June 1-Nov. 8, 2016 | ||||||||||||||||||||||||||||||||||||||||||||||||||||||||||||||||||||||||||||||||||||||||||||||||||||
| Spanish-language Hispanic | 1,787 | 1.6 | ||||||||||||||||||||||||||||||||||||||||||||||||||||||||||||||||||||||||||||||||||||||||||||||||||
| English-language Hispanic | 4,104 | 1.4 | ||||||||||||||||||||||||||||||||||||||||||||||||||||||||||||||||||||||||||||||||||||||||||||||||||
| All Hispanic | 5,892 | 1.2 | ||||||||||||||||||||||||||||||||||||||||||||||||||||||||||||||||||||||||||||||||||||||||||||||||||
| White | 35,437 | 0.6 | ||||||||||||||||||||||||||||||||||||||||||||||||||||||||||||||||||||||||||||||||||||||||||||||||||
| Black | 5,363 | 1.2 | ||||||||||||||||||||||||||||||||||||||||||||||||||||||||||||||||||||||||||||||||||||||||||||||||||
| Nov. 9, 2016-Jun. 30, 2017 | ||||||||||||||||||||||||||||||||||||||||||||||||||||||||||||||||||||||||||||||||||||||||||||||||||||
| Spanish-language Hispanic | 2,669 | 1.6 | ||||||||||||||||||||||||||||||||||||||||||||||||||||||||||||||||||||||||||||||||||||||||||||||||||
| English-language Hispanic | 7,057 | 1.1 | ||||||||||||||||||||||||||||||||||||||||||||||||||||||||||||||||||||||||||||||||||||||||||||||||||
| All Hispanic | 9,716 | 1.0 | ||||||||||||||||||||||||||||||||||||||||||||||||||||||||||||||||||||||||||||||||||||||||||||||||||
| White | 55,160 | 0.5 | ||||||||||||||||||||||||||||||||||||||||||||||||||||||||||||||||||||||||||||||||||||||||||||||||||
| Black | 8,512 | 1.0 | ||||||||||||||||||||||||||||||||||||||||||||||||||||||||||||||||||||||||||||||||||||||||||||||||||
| Aug. 1-Nov. 8, 2016 | ||||||||||||||||||||||||||||||||||||||||||||||||||||||||||||||||||||||||||||||||||||||||||||||||||||
| Spanish-Language Hispanic | 1,079 | 2.0 | ||||||||||||||||||||||||||||||||||||||||||||||||||||||||||||||||||||||||||||||||||||||||||||||||||
| English-Language Hispanic | 2,532 | 1.7 | ||||||||||||||||||||||||||||||||||||||||||||||||||||||||||||||||||||||||||||||||||||||||||||||||||
| White | 22,315 | 0.7 | ||||||||||||||||||||||||||||||||||||||||||||||||||||||||||||||||||||||||||||||||||||||||||||||||||
| Black | 3,313 | 1.3 | ||||||||||||||||||||||||||||||||||||||||||||||||||||||||||||||||||||||||||||||||||||||||||||||||||
| Nov. 9, 2016-Jan 19, 2017 | ||||||||||||||||||||||||||||||||||||||||||||||||||||||||||||||||||||||||||||||||||||||||||||||||||||
| Spanish-language Hispanic | 804 | 2.8 | ||||||||||||||||||||||||||||||||||||||||||||||||||||||||||||||||||||||||||||||||||||||||||||||||||
| English-language Hispanic | 1,829 | 2.1 | ||||||||||||||||||||||||||||||||||||||||||||||||||||||||||||||||||||||||||||||||||||||||||||||||||
| White | 15,188 | 0.9 | ||||||||||||||||||||||||||||||||||||||||||||||||||||||||||||||||||||||||||||||||||||||||||||||||||
| Black | 2,245 | 1.6 | ||||||||||||||||||||||||||||||||||||||||||||||||||||||||||||||||||||||||||||||||||||||||||||||||||
| Jan. 20-March 30, 2017 | ||||||||||||||||||||||||||||||||||||||||||||||||||||||||||||||||||||||||||||||||||||||||||||||||||||
| Spanish-language Hispanic | 856 | 2.7 | ||||||||||||||||||||||||||||||||||||||||||||||||||||||||||||||||||||||||||||||||||||||||||||||||||
| English-language Hispanic | 2,315 | 1.9 | ||||||||||||||||||||||||||||||||||||||||||||||||||||||||||||||||||||||||||||||||||||||||||||||||||
| White | 17,784 | 0.8 | ||||||||||||||||||||||||||||||||||||||||||||||||||||||||||||||||||||||||||||||||||||||||||||||||||
| Black | 2,751 | 1.6 | ||||||||||||||||||||||||||||||||||||||||||||||||||||||||||||||||||||||||||||||||||||||||||||||||||
| April 1-June 30, 2017 | ||||||||||||||||||||||||||||||||||||||||||||||||||||||||||||||||||||||||||||||||||||||||||||||||||||
| Spanish-language Hispanic | 1,009 | 2.4 | ||||||||||||||||||||||||||||||||||||||||||||||||||||||||||||||||||||||||||||||||||||||||||||||||||
| English-language Hispanic | 2,913 | 1.7 | ||||||||||||||||||||||||||||||||||||||||||||||||||||||||||||||||||||||||||||||||||||||||||||||||||
| White | 22,208 | 0.7 | ||||||||||||||||||||||||||||||||||||||||||||||||||||||||||||||||||||||||||||||||||||||||||||||||||
| Black | 3,514 | 1.4 | ||||||||||||||||||||||||||||||||||||||||||||||||||||||||||||||||||||||||||||||||||||||||||||||||||
| Gallup-Sharecare Well-Being Index | ||||||||||||||||||||||||||||||||||||||||||||||||||||||||||||||||||||||||||||||||||||||||||||||||||||
Results from the 2016 Gallup Minority Rights and Relations survey are based on telephone interviews conducted June 7-July 1, 2016, with a random sample of 906 Hispanics, aged 18 and older, living in all 50 U.S. states and the District of Columbia. For results based on the total sample of Hispanic adults, the margin of sampling error is ±6 percentage points at the 95% confidence level.