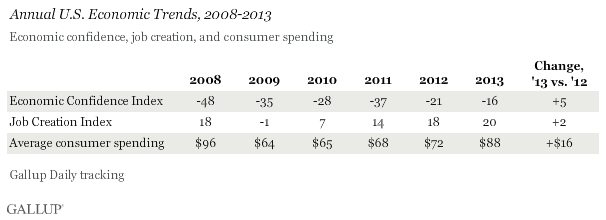
WASHINGTON, D.C. -- Three key Gallup consumer-based measures of the U.S. economy showed overall growth in 2013, despite monthly fluctuations. Gallup's U.S. Economic Confidence Index averaged -16 for 2013, up five points from 2012; its Job Creation Index averaged +20, up two points from 2012; and average daily self-reported spending increased to $88, up $16 from 2012.

Despite Monthly Swings, U.S. Economic Confidence Rose in 2013
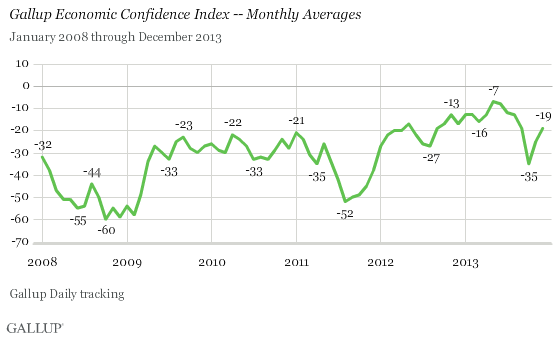
Americans' confidence in the economy improved in 2013, including high points of -7 in May and -8 in June -- the best two months since Gallup began tracking this measure daily in 2008. But there were also some large downturns occurring around pivotal political events. For example, amid the federal government shutdown and partisan bickering over the federal debt limit, the Economic Confidence Index plunged as low as -35 in October. Despite these setbacks, the index for 2013 is the highest Gallup has measured since Daily tracking began in 2008, even though it was still in negative territory.

The index represents Americans' net optimism about the economy, combining their views about current economic conditions and their perceptions of the economy's direction. The index has a theoretical maximum of +100 if all Americans think the economy is "excellent" or "good" and improving, and a theoretical minimum of -100 if all believe the economy is "only fair" or "poor" and getting worse.
By income level, the largest increase in confidence last year was among those with annual household incomes of $90,000 or more. The index among this group improved by seven points to -5 in 2013. By comparison, confidence among Americans with annual household incomes below $90,000 rose three points to -18.
Democrats were more positive than negative about the economy last year, with an index of +13. Meanwhile, Republicans' index remained entrenched in negative territory, averaging -44. Democrats have been significantly more optimistic than Republicans about economic conditions since early 2009 -- shortly after President Barack Obama took office. Although Republicans' confidence is significantly lower than Democrats', Republicans' index improved seven points in 2013, while the Democrats' average score was unchanged from 2012.
U.S. Job Creation Improved Slightly Last Year
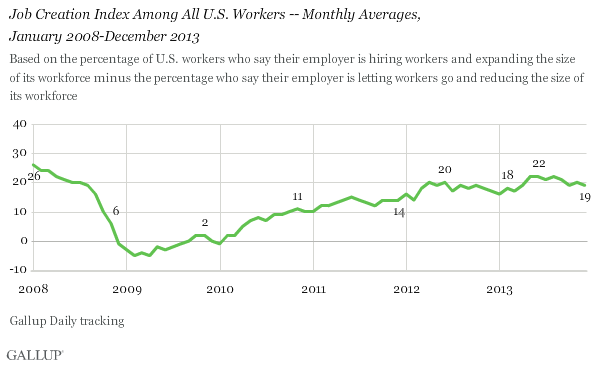
Gallup's Job Creation Index averaged +20 for 2013, up slightly from +18 in 2012, and the highest annual average in Gallup's six-year history of tracking this measure.

The index is a measure of net hiring in the U.S., based on responses from a nationally representative sample of full- and part-time workers. In 2013, an average of 36% of all workers said their employer was hiring employees and expanding the size of its workforce, while 16% said their employer was letting workers go and reducing the overall size of its workforce, resulting in the +20 net hiring score.
The Midwest region registered the highest score of +22, while the East had the lowest, at +17. The West, however, had the greatest improvement in 2013, rising five points to +20.
U.S Consumer Spending -- Highest Since 2008
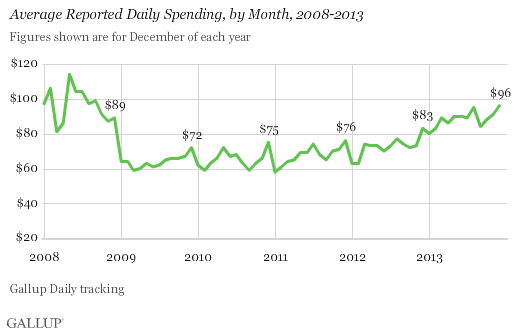
Americans' self-reported daily spending increased significantly to a monthly average of $88 in 2013, up $16 from 2012. Last year's average is the highest Gallup has measured since 2008, when spending averaged $96.

Gallup's consumer spending measure is based on Daily tracking of a question that asks Americans how much they spent the prior day, aside from normal household bills and major durables such as homes or cars.
Spending last year increased across income groups. Americans with household incomes of $90,000 or more increased their average daily spending by $26, to $153 in 2013. Americans with lower household incomes increased their spending by $16, to an average of $76 per day. The increases in average daily spending levels among upper-, middle-, and lower-income groups are the largest annual increases since Gallup began tracking Americans' spending habits daily in 2008.
Implications
The U.S. economy in 2013 showed signs of improvement in several areas, according to Gallup Daily tracking of key economic metrics. Americans are more confident in current economic conditions and the future direction of the economy than they were in the previous five years; net hiring improved, as reported through Gallup's Job Creation Index; and consumer spending -- a strong indicator of future GDP growth -- shot up significantly.
Key traditional, non-Gallup economic indicators also improved last year. U.S. economic output as reported by the Bureau of Economic Analysis increased as the year went on, with third quarter real GDP growing by an annual rate of 4.1%, after 2.5% growth in the second quarter and 1.1% in the first quarter. In addition, the U.S. stock market had a year of record highs, with roughly a 30% gain in the S&P 500, and housing prices appreciated as continuing low interest rates boosted demand.
While the 2013 economic data are a positive sign that the U.S. economy is recovering from the 2008-2009 economic recession, it is still unclear whether the economy is fundamentally strong, especially considering the support it received from the Federal Reserve during the past two years. The Fed took an aggressive stance on stimulating the economy from mid-2012 through 2013 by keeping interest rates historically low via its bond purchasing program -- but a few weeks ago, the Fed announced that beginning in January, it would start to taper its monthly buying.
This has the potential to drive up interest rates, increasing borrowing costs for home buyers and potential and existing business owners -- which in turn could negatively affect housing markets, consumer spending, and job creation. The Fed has indicated it will seek to keep short-term interest rates low until unemployment drops a bit more or until inflation becomes a concern; however, it is unlikely that the U.S. will continue to experience the record-low interest rates seen in 2013.
In addition to worries about future interest rate hikes and the associated risks, the labor market is also a pressing concern. While the unemployment rate as reported by the Bureau of Labor Statistics has declined since 2010, the U.S. still has a ways to go before getting back to pre-recession levels of around 4.5% to 5%. Gallup found that unemployment was lower in 2013 compared with recent years but its Payroll to Population rate -- the percentage of adults employed full time by an employer -- showed no improvement in 2013. This may be attributable to more Americans dropping out of the workforce or more becoming self-employed.
Gallup.com reports results from these indexes in daily, weekly, and monthly averages and in Gallup.com stories. Complete trend data are always available to view and export in the following charts:
Daily: Employment, Economic Confidence, Job Creation, Consumer Spending
Weekly: Employment, Economic Confidence, Job Creation, Consumer Spending
Read more about Gallup's economic measures.
View our economic release schedule.
Survey Methods
Results for this Gallup poll are based on telephone interviews conducted Jan. 2-Dec. 29, 2013, on the Gallup Daily tracking survey, with a random sample of adults, aged 18 and older, living in all 50 U.S. states and the District of Columbia.
Economic confidence results are based on interviews with 178,071 U.S. adults.
Spending results are based on interviews with 178,520 U.S. adults.
Job Creation results are based on interviews with 208,759 employed adults.
For results based on the total sample of national adults, the margin of sampling error is ±1 percentage point at the 95% confidence level.
Interviews are conducted with respondents on landline telephones and cellular phones, with interviews conducted in Spanish for respondents who are primarily Spanish-speaking. Each sample of national adults includes a minimum quota of 50% cellphone respondents and 50% landline respondents, with additional minimum quotas by region. Landline and cell telephone numbers are selected using random-digit-dial methods. Landline respondents are chosen at random within each household on the basis of which member had the most recent birthday.
Samples are weighted to correct for unequal selection probability, nonresponse, and double coverage of landline and cell users in the two sampling frames. They are also weighted to match the national demographics of gender, age, race, Hispanic ethnicity, education, region, population density, and phone status (cellphone only/landline only/both, and cellphone mostly). Demographic weighting targets are based on the March 2012 Current Population Survey figures for the aged 18 and older U.S. population. Phone status targets are based on the July-December 2011 National Health Interview Survey. Population density targets are based on the 2010 census. All reported margins of sampling error include the computed design effects for weighting.
In addition to sampling error, question wording and practical difficulties in conducting surveys can introduce error or bias into the findings of public opinion polls.
For more details on Gallup's polling methodology, visit www.gallup.com.
