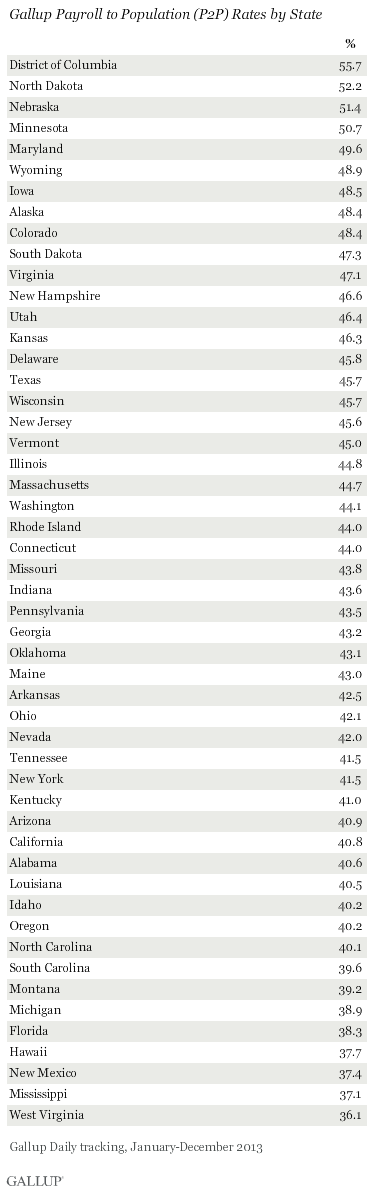
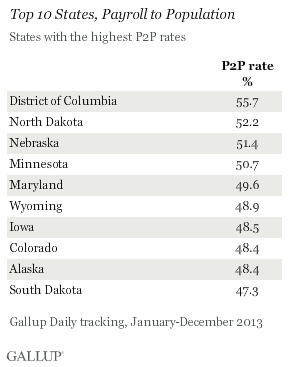
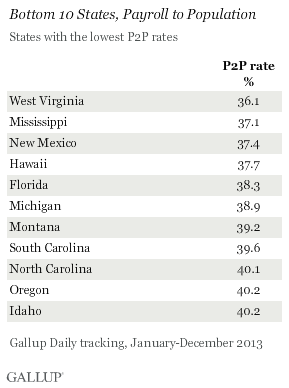
WASHINGTON, D.C. -- Washington, D.C., had the highest Payroll to Population (P2P) rate in the country in 2013, at 55.7%. A cluster of states in the Northern Great Plains and Rocky Mountain regions -- North Dakota, Nebraska, Minnesota, Wyoming, Iowa, Colorado, and South Dakota -- all made the top 10. West Virginia (36.1%) had the lowest P2P rate of all the states.
 |
| Explore complete state data > |
Midwestern States Had Lowest Underemployment Rates
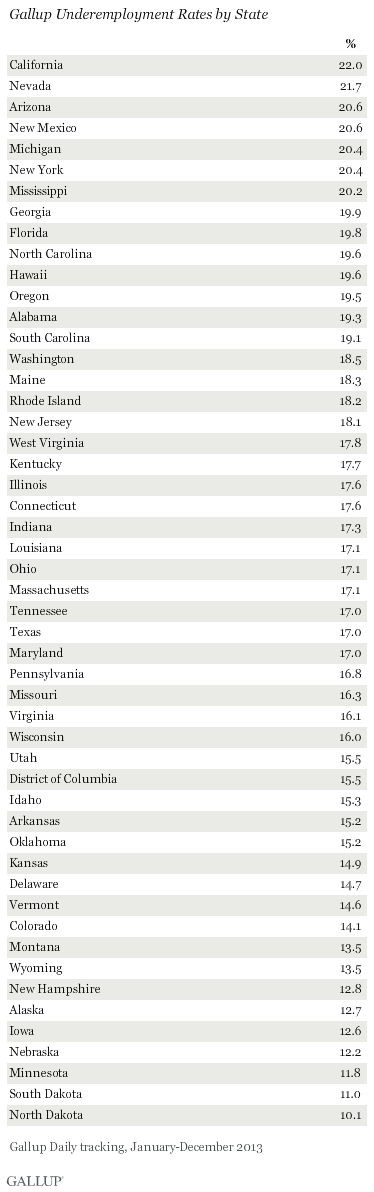
As with Payroll to Population rates, states in the Midwest -- including North and South Dakota, Minnesota, Nebraska, and Iowa -- were among those with the best underemployment rates in 2013.
Gallup's U.S. underemployment rate combines the percentage of adults in the workforce that is unemployed with the percentage of those working part time but looking for full-time work. While P2P reflects the relative size of the population that is working full time for an employer, the underemployment rate reflects the relative size of the workforce that is not working at capacity, but would like to be.
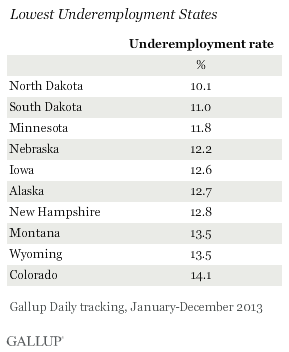
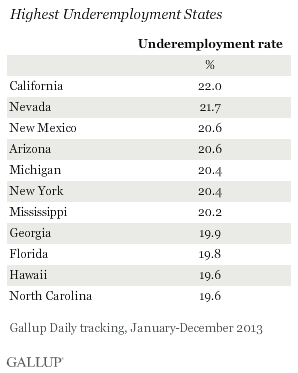
California and Nevada have the highest percentages of their workforces not working at desired capacity. Their rates are about twice those of states at the other end of the spectrum, such as North Dakota (10.1%). Other states hard hit by the recession and declining housing market, including Florida and Arizona, rank among the states with the highest underemployment rates.
Full results for P2P and underemployment by state can be found on page 2.
Bottom Line
North Dakota, South Dakota, Nebraska, Iowa, and Minnesota ranked in the top 10 states on P2P rates in 2013, and in the bottom 10 for underemployment, as well as in the top 10 on Gallup's Job Creation Index, highlighting the strong job markets in the Midwest.
In contrast, Mississippi, Florida, New Mexico, Hawaii, Michigan, and North Carolina ranked in the bottom 10 states on P2P rates, and are among the states with the highest underemployment rates. There is more overlap between the top 10 P2P states and low underemployment states than there is among the bottom 10 P2P states and high underemployment states on the two measures. That is mainly because many of the states with low P2P rates also have low workforce participation rates. They still have much room for both job growth and labor force mobilization.
Gallup's "State of the States" series reveals state-by-state differences on political, economic, and well-being measures Gallup tracks each day. New stories based on full-year 2013 data will be released throughout February.
Gallup.com reports results from these indexes in daily, weekly, and monthly averages and in Gallup.com stories. Complete trend data are always available to view and export in the following charts:
Daily: Employment, Economic Confidence, Job Creation, Consumer Spending
Weekly: Employment, Economic Confidence, Job Creation, Consumer Spending
Read more about Gallup's economic measures.
View our economic release schedule.
Survey Methods
Results are based on telephone interviews conducted as part of Gallup Daily tracking from Jan. 2-Dec. 29, 2013, with a random sample of 356,586 adults, aged 18 and older, selected using random-digit-dial sampling.
For results based on the total sample of national adults, one can say with 95% confidence that the maximum margin of sampling error is less than ±1 percentage point.
Margins of error for individual states are no greater than ±6 percentage points, and are ±3 percentage points or less in most states.
Interviews are conducted with respondents on landline telephones and cellular phones, with interviews conducted in Spanish for respondents who are primarily Spanish-speaking. Each sample of national adults includes a minimum quota of 50% cellphone respondents and 50% landline respondents, with additional minimum quotas by region. Landline telephone numbers are chosen at random among listed telephone numbers. Cellphone numbers are selected using random-digit-dial methods. Landline respondents are chosen at random within each household on the basis of which member had the most recent birthday.
Samples are weighted to correct for unequal selection probability, nonresponse, and double coverage of landline and cell users in the two sampling frames. They are also weighted to match the national demographics of gender, age, race, Hispanic ethnicity, education, region, population density, and phone status (cellphone only/landline only/both, cellphone mostly, and having an unlisted landline number). Demographic weighting targets are based on the most recent Current Population Survey figures for the aged 18 and older U.S. population. Phone status targets are based on the most recent National Health Interview Survey. Population density targets are based on the most recent U.S. census. All reported margins of sampling error include the computed design effects for weighting.
In addition to sampling error, question wording and practical difficulties in conducting surveys can introduce error or bias into the findings of public opinion polls.
For more details on Gallup's polling methodology, visit www.gallup.com.