Story Highlights
- Nearly half of blacks say their local police treat blacks unfairly
- More whites say blacks treated unfairly in dealings with police
- Blacks who report personal mistreatment by police steady at 16%
PRINCETON, N.J. -- Just before the July 5 and July 6 fatal shootings of black men during routine law enforcement encounters in Louisiana and Minnesota, blacks in the U.S. were evenly divided over the treatment of blacks by their local police. Half of blacks responded in a June 7-July 1 Gallup poll that police in their local area treat blacks and other racial minorities fairly, while 48% said they treat blacks unfairly.
| Jun 15-Jul 10, 2015 | Jun 7-Jul 1, 2016 | ||||||||||||||||||||||||||||||||||||||||||||||||||||||||||||||||||||||||||||||||||||||||||||||||||
|---|---|---|---|---|---|---|---|---|---|---|---|---|---|---|---|---|---|---|---|---|---|---|---|---|---|---|---|---|---|---|---|---|---|---|---|---|---|---|---|---|---|---|---|---|---|---|---|---|---|---|---|---|---|---|---|---|---|---|---|---|---|---|---|---|---|---|---|---|---|---|---|---|---|---|---|---|---|---|---|---|---|---|---|---|---|---|---|---|---|---|---|---|---|---|---|---|---|---|---|
| % | % | ||||||||||||||||||||||||||||||||||||||||||||||||||||||||||||||||||||||||||||||||||||||||||||||||||
| Very fairly | 8 | 9 | |||||||||||||||||||||||||||||||||||||||||||||||||||||||||||||||||||||||||||||||||||||||||||||||||
| Fairly | 44 | 41 | |||||||||||||||||||||||||||||||||||||||||||||||||||||||||||||||||||||||||||||||||||||||||||||||||
| Unfairly | 33 | 29 | |||||||||||||||||||||||||||||||||||||||||||||||||||||||||||||||||||||||||||||||||||||||||||||||||
| Very unfairly | 15 | 19 | |||||||||||||||||||||||||||||||||||||||||||||||||||||||||||||||||||||||||||||||||||||||||||||||||
| Total fairly | 52 | 50 | |||||||||||||||||||||||||||||||||||||||||||||||||||||||||||||||||||||||||||||||||||||||||||||||||
| Total unfairly | 48 | 48 | |||||||||||||||||||||||||||||||||||||||||||||||||||||||||||||||||||||||||||||||||||||||||||||||||
| Gallup | |||||||||||||||||||||||||||||||||||||||||||||||||||||||||||||||||||||||||||||||||||||||||||||||||||
Nineteen percent of blacks thought local police treated blacks very unfairly, similar to what Gallup found in 2015.
These results are based on Gallup's Minority Rights and Relations survey. The 2016 poll was conducted by telephone with 3,270 national adults, including large oversamples of blacks and Hispanics.
Although young black men have been the focal point of recent news stories about police shootings, black women -- along with younger blacks -- are more likely to express criticism of the police than are black men and older blacks. Fifty-three percent of black women versus 43% of black men say local police treat blacks and other minorities unfairly. Similarly, 52% of blacks aged 18 to 49 versus 43% of blacks 50 and older think police treatment of minorities is unfair.
| Very fairly/Fairly | Very unfairly/Unfairly | ||||||||||||||||||||||||||||||||||||||||||||||||||||||||||||||||||||||||||||||||||||||||||||||||||
|---|---|---|---|---|---|---|---|---|---|---|---|---|---|---|---|---|---|---|---|---|---|---|---|---|---|---|---|---|---|---|---|---|---|---|---|---|---|---|---|---|---|---|---|---|---|---|---|---|---|---|---|---|---|---|---|---|---|---|---|---|---|---|---|---|---|---|---|---|---|---|---|---|---|---|---|---|---|---|---|---|---|---|---|---|---|---|---|---|---|---|---|---|---|---|---|---|---|---|---|
| % | % | ||||||||||||||||||||||||||||||||||||||||||||||||||||||||||||||||||||||||||||||||||||||||||||||||||
| Black men | 56 | 43 | |||||||||||||||||||||||||||||||||||||||||||||||||||||||||||||||||||||||||||||||||||||||||||||||||
| Black women | 45 | 53 | |||||||||||||||||||||||||||||||||||||||||||||||||||||||||||||||||||||||||||||||||||||||||||||||||
| Blacks 18 to 49 | 47 | 52 | |||||||||||||||||||||||||||||||||||||||||||||||||||||||||||||||||||||||||||||||||||||||||||||||||
| Blacks 50+ | 55 | 43 | |||||||||||||||||||||||||||||||||||||||||||||||||||||||||||||||||||||||||||||||||||||||||||||||||
| Gallup, June 7-July 1, 2016 | |||||||||||||||||||||||||||||||||||||||||||||||||||||||||||||||||||||||||||||||||||||||||||||||||||
The views of male and female blacks, as well as younger and older blacks, are similar to what Gallup found when first asking this question last year.
Black Americans' perceptions of how racial minorities are treated by local police are markedly different from the views of Hispanics and non-Hispanic whites. While almost half of blacks believe racial minorities are treated unfairly, only 34% of Hispanics and 20% of whites agree.
| Very fairly/Fairly | Very unfairly/Unfairly | |||||||||||||||||||||||||||||||||||||||||||||||||||||||||||||||||||||||||||||||||||||||||||||||||||
|---|---|---|---|---|---|---|---|---|---|---|---|---|---|---|---|---|---|---|---|---|---|---|---|---|---|---|---|---|---|---|---|---|---|---|---|---|---|---|---|---|---|---|---|---|---|---|---|---|---|---|---|---|---|---|---|---|---|---|---|---|---|---|---|---|---|---|---|---|---|---|---|---|---|---|---|---|---|---|---|---|---|---|---|---|---|---|---|---|---|---|---|---|---|---|---|---|---|---|---|---|
| % | % | |||||||||||||||||||||||||||||||||||||||||||||||||||||||||||||||||||||||||||||||||||||||||||||||||||
| Jun 7-Jul 1, 2016 | ||||||||||||||||||||||||||||||||||||||||||||||||||||||||||||||||||||||||||||||||||||||||||||||||||||
| U.S. adults | 71 | 26 | ||||||||||||||||||||||||||||||||||||||||||||||||||||||||||||||||||||||||||||||||||||||||||||||||||
| Blacks | 50 | 48 | ||||||||||||||||||||||||||||||||||||||||||||||||||||||||||||||||||||||||||||||||||||||||||||||||||
| Hispanics | 65 | 34 | ||||||||||||||||||||||||||||||||||||||||||||||||||||||||||||||||||||||||||||||||||||||||||||||||||
| Non-Hispanic whites | 77 | 20 | ||||||||||||||||||||||||||||||||||||||||||||||||||||||||||||||||||||||||||||||||||||||||||||||||||
| Jun 15-Jul 10, 2015 | ||||||||||||||||||||||||||||||||||||||||||||||||||||||||||||||||||||||||||||||||||||||||||||||||||||
| U.S. adults | 73 | 25 | ||||||||||||||||||||||||||||||||||||||||||||||||||||||||||||||||||||||||||||||||||||||||||||||||||
| Blacks | 52 | 48 | ||||||||||||||||||||||||||||||||||||||||||||||||||||||||||||||||||||||||||||||||||||||||||||||||||
| Hispanics | 71 | 29 | ||||||||||||||||||||||||||||||||||||||||||||||||||||||||||||||||||||||||||||||||||||||||||||||||||
| Non-Hispanic whites | 78 | 19 | ||||||||||||||||||||||||||||||||||||||||||||||||||||||||||||||||||||||||||||||||||||||||||||||||||
| Gallup | ||||||||||||||||||||||||||||||||||||||||||||||||||||||||||||||||||||||||||||||||||||||||||||||||||||
Whites Express Record-High Belief That Blacks Are Treated Worse by Police
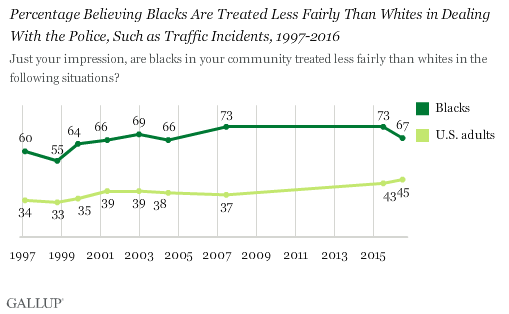
A longer-term Gallup trend asking Americans how blacks in their community are treated compared with whites in "dealing with the police, such as traffic incidents" finds even broader dissatisfaction among blacks. Two-thirds of blacks say blacks are treated less fairly than whites in such encounters. While down slightly from last year's 73%, it is still higher than the 55% and 60% readings in the late 1990s.
Hispanics (45%) and non-Hispanic whites (40%) are far less likely than blacks to perceive a disparity in police treatment by race. However, the percentage of whites expressing this sentiment is up from 34% in 2015.
As a result, the overall percentage of Americans believing blacks receive worse treatment than whites from the police remains at a record high -- 45%, statistically similar to the 43% recorded in 2015.

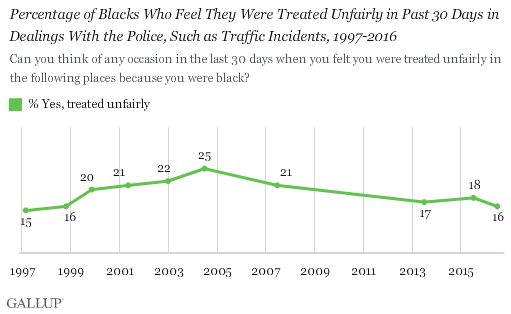
Meanwhile, the percentage of blacks reporting that they personally have experienced unfair treatment from police -- now 16% -- is similar to the level Gallup has recorded since 2013. From 1999 through 2007, the percentage was slightly higher than it is now, ranging between 20% and 25%.

Bottom Line
A video of several police officers beating Rodney King after a high-speed chase in Los Angeles in 1991 gave the public a rare, pre-smartphone glimpse of police brutality that proved explosive. The proliferation of camera phones and social media has made similar images commonplace in recent years, possibly contributing to heightened public concern about such events. Most notably, even before the recent shootings, four in 10 whites, up from 34% last year, thought the police in their community treat blacks less fairly than whites. Also, the percentage of blacks believing the police treat blacks and other racial minorities less fairly than whites was on the high side of Gallup's two-decade trend, even as the percentage who personally felt mistreated within the previous month remained on the low side.
More broadly, negative views of local police are by no means universal among black Americans. In fact, before the latest incidents, as many blacks said their local police are fair in their dealings with blacks as said they are unfair. But a huge racial gap remains, with the majority of Hispanics and non-Hispanic whites believing blacks are treated fairly.
Historical data are available in Gallup Analytics.
Survey Methods
Results for this Gallup poll are based on telephone interviews conducted June 7-July 1, 2016, with a sample of 3,270 adults, aged 18 and older, living in all 50 U.S. states and the District of Columbia, who had previously been interviewed in the Gallup Daily tracking poll and agreed to be re-interviewed for a later study. The sample is weighted to be representative of U.S. adults.
For results based on the total sample of national adults, the margin of sampling error is ±3 percentage points at the 95% confidence level. For results based on the sample of 1,320 non-Hispanic whites, the margin of sampling error is ±4 percentage points at the 95% confidence level. For results based on the sample of 912 non-Hispanic blacks, the margin of sampling error is ±5 percentage points at the 95% confidence level. For results based on the sample of 906 Hispanics, the margin of sampling error is ±6 percentage points at the 95% confidence level. (271 out of the 906 interviews with Hispanics were conducted in Spanish.)
All reported margins of sampling error include computed design effects for weighting.
Learn more about how the Gallup Poll Social Series works.


