Story Highlights
- Restaurants lead industries with 66% positive, 7% negative ratings
- Computer industry a close second at 66% positive, 13% negative
- Federal government again ranked last
PRINCETON, N.J. -- The restaurant and computer industries, long among the best-rated U.S. industries in Gallup's annual measure of U.S. business sectors, again lead the poll, with 66% of Americans rating each positively. However, with only 7% of Americans viewing the restaurant industry negatively vs. 13% for the computer industry, the restaurant industry enjoys the more positive overall image this year.
| Total positive | Neutral | Total negative | Net positive | ||||||||||||||||||||||||||||||||||||||||||||||||||||||||||||||||||||||||||||||||||||||||||||||||
|---|---|---|---|---|---|---|---|---|---|---|---|---|---|---|---|---|---|---|---|---|---|---|---|---|---|---|---|---|---|---|---|---|---|---|---|---|---|---|---|---|---|---|---|---|---|---|---|---|---|---|---|---|---|---|---|---|---|---|---|---|---|---|---|---|---|---|---|---|---|---|---|---|---|---|---|---|---|---|---|---|---|---|---|---|---|---|---|---|---|---|---|---|---|---|---|---|---|---|---|
| % | % | % | pct. pts. | ||||||||||||||||||||||||||||||||||||||||||||||||||||||||||||||||||||||||||||||||||||||||||||||||
| Restaurant industry | 66 | 27 | 7 | +59 | |||||||||||||||||||||||||||||||||||||||||||||||||||||||||||||||||||||||||||||||||||||||||||||||
| Computer industry | 66 | 19 | 13 | +53 | |||||||||||||||||||||||||||||||||||||||||||||||||||||||||||||||||||||||||||||||||||||||||||||||
| Grocery industry | 54 | 28 | 18 | +36 | |||||||||||||||||||||||||||||||||||||||||||||||||||||||||||||||||||||||||||||||||||||||||||||||
| Farming and agriculture | 55 | 23 | 20 | +35 | |||||||||||||||||||||||||||||||||||||||||||||||||||||||||||||||||||||||||||||||||||||||||||||||
| Accounting | 45 | 40 | 12 | +33 | |||||||||||||||||||||||||||||||||||||||||||||||||||||||||||||||||||||||||||||||||||||||||||||||
| Travel industry | 48 | 33 | 16 | +32 | |||||||||||||||||||||||||||||||||||||||||||||||||||||||||||||||||||||||||||||||||||||||||||||||
| Internet industry | 53 | 21 | 24 | +29 | |||||||||||||||||||||||||||||||||||||||||||||||||||||||||||||||||||||||||||||||||||||||||||||||
| Automobile industry | 50 | 26 | 23 | +27 | |||||||||||||||||||||||||||||||||||||||||||||||||||||||||||||||||||||||||||||||||||||||||||||||
| Retail industry | 49 | 26 | 23 | +26 | |||||||||||||||||||||||||||||||||||||||||||||||||||||||||||||||||||||||||||||||||||||||||||||||
| Real estate industry | 44 | 31 | 21 | +23 | |||||||||||||||||||||||||||||||||||||||||||||||||||||||||||||||||||||||||||||||||||||||||||||||
| Gallup, Aug. 3-7, 2016 | |||||||||||||||||||||||||||||||||||||||||||||||||||||||||||||||||||||||||||||||||||||||||||||||||||
The restaurant and computer sectors have vied for the most well-reviewed U.S. industry in each of Gallup's annual measures of this question since 2001. This year's +59 net-positive score for the restaurant industry is well above its average +51 since 2001, whereas the computer industry's +53 net-positive score is about average for that industry.
Two other industries connected with food -- grocery and farming/agriculture -- rank near the top in the Aug. 3-7 poll. The remaining six industries in the top 10 represent a hodgepodge of sectors including the accounting, travel, internet, automobile, retail and real estate industries. All of these enjoy better than 2-to-1 positive over negative ratings.
Americans view another 10 industries no worse than neutrally, but in most cases net-positively. The telephone and airline industries lead this group, and it includes several entertainment and communication-related arenas: sports, movies, television and radio, publishing and advertising. Electric and gas utilities, education and banking also make this list.
| Total positive | Neutral | Total negative | Net positive | ||||||||||||||||||||||||||||||||||||||||||||||||||||||||||||||||||||||||||||||||||||||||||||||||
|---|---|---|---|---|---|---|---|---|---|---|---|---|---|---|---|---|---|---|---|---|---|---|---|---|---|---|---|---|---|---|---|---|---|---|---|---|---|---|---|---|---|---|---|---|---|---|---|---|---|---|---|---|---|---|---|---|---|---|---|---|---|---|---|---|---|---|---|---|---|---|---|---|---|---|---|---|---|---|---|---|---|---|---|---|---|---|---|---|---|---|---|---|---|---|---|---|---|---|---|
| % | % | % | pct. pts. | ||||||||||||||||||||||||||||||||||||||||||||||||||||||||||||||||||||||||||||||||||||||||||||||||
| Telephone industry | 42 | 31 | 27 | +15 | |||||||||||||||||||||||||||||||||||||||||||||||||||||||||||||||||||||||||||||||||||||||||||||||
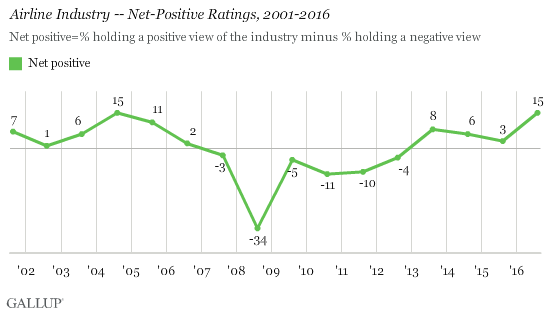
| Airline industry | 41 | 30 | 26 | +15 | |||||||||||||||||||||||||||||||||||||||||||||||||||||||||||||||||||||||||||||||||||||||||||||||
| Sports industry | 41 | 31 | 27 | +14 | |||||||||||||||||||||||||||||||||||||||||||||||||||||||||||||||||||||||||||||||||||||||||||||||
| Publishing industry | 39 | 32 | 27 | +12 | |||||||||||||||||||||||||||||||||||||||||||||||||||||||||||||||||||||||||||||||||||||||||||||||
| Movie industry | 42 | 24 | 32 | +10 | |||||||||||||||||||||||||||||||||||||||||||||||||||||||||||||||||||||||||||||||||||||||||||||||
| Electric and gas utilities | 42 | 23 | 33 | +9 | |||||||||||||||||||||||||||||||||||||||||||||||||||||||||||||||||||||||||||||||||||||||||||||||
| Education | 44 | 17 | 38 | +6 | |||||||||||||||||||||||||||||||||||||||||||||||||||||||||||||||||||||||||||||||||||||||||||||||
| Television and radio | 40 | 23 | 38 | +2 | |||||||||||||||||||||||||||||||||||||||||||||||||||||||||||||||||||||||||||||||||||||||||||||||
| Banking | 38 | 23 | 36 | +2 | |||||||||||||||||||||||||||||||||||||||||||||||||||||||||||||||||||||||||||||||||||||||||||||||
| Advertising and public relations | 35 | 27 | 35 | 0 | |||||||||||||||||||||||||||||||||||||||||||||||||||||||||||||||||||||||||||||||||||||||||||||||
| Gallup, Aug. 3-7, 2016 | |||||||||||||||||||||||||||||||||||||||||||||||||||||||||||||||||||||||||||||||||||||||||||||||||||
Federal Government Edges Out Pharmaceuticals and Healthcare at Bottom
The bottom five industries are all reviewed more negatively than positively, with three -- the federal government, pharmaceuticals and healthcare -- receiving negative ratings from more than half of the public. The legal field plus oil and gas have just slightly higher negative than positive ratings. While fairly typical for the legal field, this represents a significantly improved positioning for the oil and gas industry, which had skewed strongly negative from 2004 through 2014.
| Total positive | Neutral | Total negative | Net positive | ||||||||||||||||||||||||||||||||||||||||||||||||||||||||||||||||||||||||||||||||||||||||||||||||
|---|---|---|---|---|---|---|---|---|---|---|---|---|---|---|---|---|---|---|---|---|---|---|---|---|---|---|---|---|---|---|---|---|---|---|---|---|---|---|---|---|---|---|---|---|---|---|---|---|---|---|---|---|---|---|---|---|---|---|---|---|---|---|---|---|---|---|---|---|---|---|---|---|---|---|---|---|---|---|---|---|---|---|---|---|---|---|---|---|---|---|---|---|---|---|---|---|---|---|---|
| % | % | % | pct. pts. | ||||||||||||||||||||||||||||||||||||||||||||||||||||||||||||||||||||||||||||||||||||||||||||||||
| Oil and gas industry | 37 | 17 | 44 | -7 | |||||||||||||||||||||||||||||||||||||||||||||||||||||||||||||||||||||||||||||||||||||||||||||||
| The legal field | 31 | 28 | 39 | -8 | |||||||||||||||||||||||||||||||||||||||||||||||||||||||||||||||||||||||||||||||||||||||||||||||
| Healthcare industry | 34 | 12 | 54 | -20 | |||||||||||||||||||||||||||||||||||||||||||||||||||||||||||||||||||||||||||||||||||||||||||||||
| Pharmaceutical industry | 28 | 19 | 51 | -23 | |||||||||||||||||||||||||||||||||||||||||||||||||||||||||||||||||||||||||||||||||||||||||||||||
| The federal government | 28 | 16 | 55 | -27 | |||||||||||||||||||||||||||||||||||||||||||||||||||||||||||||||||||||||||||||||||||||||||||||||
| Gallup, Aug. 3-7, 2016 | |||||||||||||||||||||||||||||||||||||||||||||||||||||||||||||||||||||||||||||||||||||||||||||||||||
Airline Industry Improves; Healthcare and Pharma Sink
The biggest improvement in industry ratings this year is for the airline industry, with its +15 net-positive rating up from +3 in 2015, and by far its best rating in more than a decade.

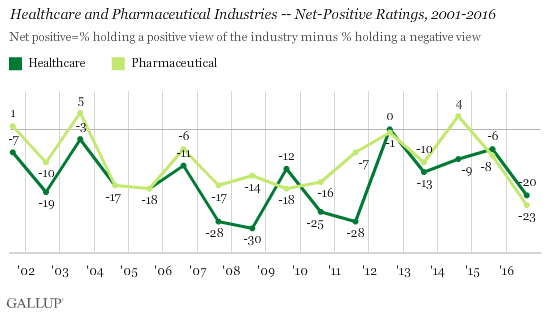
Two other industries -- healthcare and pharmaceuticals -- have gone down in public esteem. Although Democrats continue to be more positive than Republicans about the healthcare industry, as they have since 2013 when major components of the Affordable Care Act began to take effect, the healthcare industry is now at a five-year low. Its -20 net-positive score is down from -6 in 2015 and the lowest since 2011 because of declines in the past year among all party groups.
Relatedly, the pharmaceutical industry's -23 net-positive score is the worst in Gallup's 16-year trend, down from -8 in 2015.

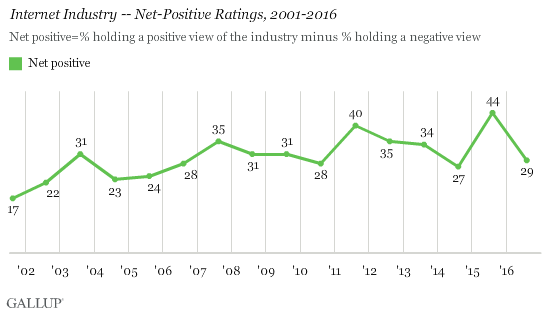
Positive ratings of the internet industry are also down sharply compared with 2015 but are similar to 2014. More generally, its ratings have tended to bounce around in recent years.

Bottom Line
At a time of persistently low public trust in the federal government, and with many more Americans rating the federal government negatively than positively, it is reassuring that Americans tend to view the bulk of 25 major U.S. business and industry sectors positively. Further, 10 of these -- ranging from some of the nation's oldest to some of its newest industries -- enjoy solidly positive ratings.
The top-scoring industries over the past 16 years -- restaurants and computers -- are both competitive ones that offer Americans enjoyment and efficiency while not stirring up major political controversies. The internet can also be a time saver in people's lives, but is known for significant privacy, security and crime risks that may keep it somewhat below computers in the overall ranking.
Historical data are available in Gallup Analytics.
Survey Methods
Results for this Gallup poll are based on telephone interviews conducted Aug. 3-7, 2016, with a random sample of 1,032 adults, aged 18 and older, living in all 50 U.S. states and the District of Columbia. Each industry was rated by a randomly chosen half sample of respondents. Results for each industry have a margin of sampling error of ±6 percentage points at the 95% confidence level. All reported margins of sampling error include computed design effects for weighting.
Each sample of national adults includes a minimum quota of 60% cellphone respondents and 40% landline respondents, with additional minimum quotas by time zone within region. Landline and cellular telephone numbers are selected using random-digit-dial methods.
View survey methodology, complete question responses and trends.
Learn more about how the Gallup Poll Social Series works.


