Story Highlights
- Average wanting to lose weight drops from 59% in 2000s to 53% in 2010s
- Gap between men and women is slimmer in this decade than in 1950s
- Fewer Americans today than in 1990s describe themselves as overweight
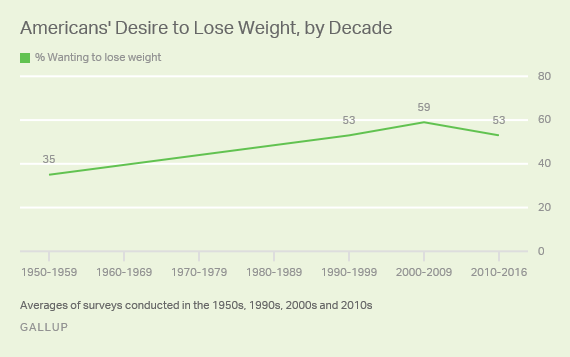
WASHINGTON, D.C. -- Americans in this decade are less likely than in the prior decade to say they want to lose weight, with the average dropping from 59% in 2000-2009 to 53% in 2010-2016. The percentage of Americans wanting to lose weight is now back to where it was in the 1990s, but still well above the 35% average that Gallup measured in the 1950s.

Losing weight was likely less important to Americans in the 1950s because obesity was far less prevalent -- or perhaps because Americans were not as conscious of fitness 60 years ago and that social norms regarding size were different then. However, whether these attitudes changed quickly or slowly isn't clear because Gallup did not ask this question in the 1960s, 1970s or 1980s. When Gallup polls picked it up again in the 1990s, the average percentage wanting to lose weight had jumped nearly 20 percentage points.
Smaller Gap Between Men, Women Wanting to Lose Weight
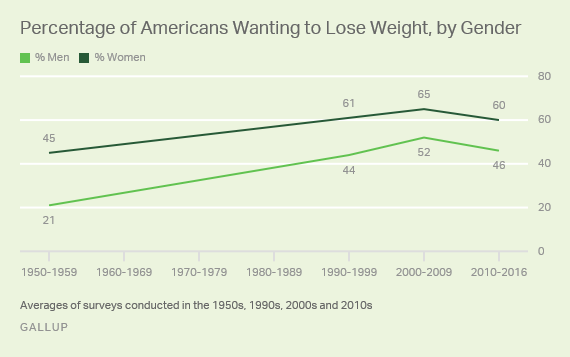
In the current decade, on average, 60% of women and 46% of men say they are interested in losing weight. While both figures are lower than they were in the 1990s, they are also much higher than averages in the 1950s. However, the gap between men and women who say they want to lose weight has narrowed since the 1950s, when more than twice as many women as men professed wanting to lose weight. In the 2000s, the gap decreased to 13 points (65% for women and 52% for men).

The gender gap is still narrower today than in the 1950s -- suggesting that men, who may have been more indifferent toward weight loss in the 1950s, remain more concerned about it in recent years.
Fewer Americans in This Decade Say They Are Overweight
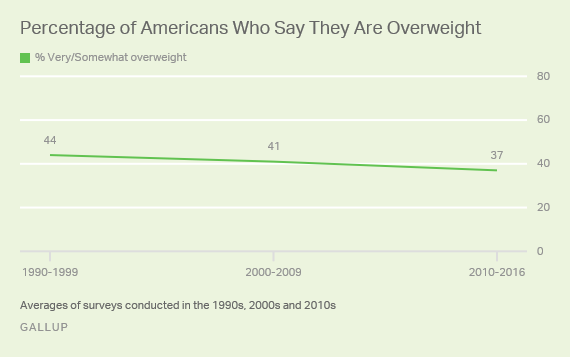
A smaller percentage of Americans now describe themselves as overweight than did so in the 1990s. The percentage saying they are overweight is down to 37% this decade from 41% in the 2000s and 44% in the 1990s.

Americans' perceptions of their ideal weight and self-reports of their actual weight have been trending upward since the 1990s. During the 1990s, Americans' average ideal weight was 153 pounds. In the 2000s, it expanded to 158; in the 2010s, ideal weight has ticked up to 161. Americans' average self-reported weight has also increased, from 166 in the 1990s to 174 in the 2000s and 176 in the current decade.
| 1990s | 2000s | 2010s | |||||||||||||||||||||||||||||||||||||||||||||||||||||||||||||||||||||||||||||||||||||||||||||||||
|---|---|---|---|---|---|---|---|---|---|---|---|---|---|---|---|---|---|---|---|---|---|---|---|---|---|---|---|---|---|---|---|---|---|---|---|---|---|---|---|---|---|---|---|---|---|---|---|---|---|---|---|---|---|---|---|---|---|---|---|---|---|---|---|---|---|---|---|---|---|---|---|---|---|---|---|---|---|---|---|---|---|---|---|---|---|---|---|---|---|---|---|---|---|---|---|---|---|---|---|
| Ideal weight | 153 | 158 | 161 | ||||||||||||||||||||||||||||||||||||||||||||||||||||||||||||||||||||||||||||||||||||||||||||||||
| Actual weight | 166 | 174 | 176 | ||||||||||||||||||||||||||||||||||||||||||||||||||||||||||||||||||||||||||||||||||||||||||||||||
| Averages of surveys conducted in the 1990s, 2000s and 2010s | |||||||||||||||||||||||||||||||||||||||||||||||||||||||||||||||||||||||||||||||||||||||||||||||||||
| Gallup | |||||||||||||||||||||||||||||||||||||||||||||||||||||||||||||||||||||||||||||||||||||||||||||||||||
Bottom Line
Body weight is a sensitive topic for many Americans. The U.S. obesity rate has actually risen to its highest point since Gallup began tracking this measure. In the 1950s, many more women than men said they wanted to lose weight -- yet in recent decades, men have almost caught up with women in their desire for a trimmer body. On the other hand, fewer Americans now than in the past two decades believe they are overweight, and the benchmark for their ideal weight continues to be set higher. These concepts may make it easier for Americans to enjoy extra portions this Thanksgiving season, especially if they feel content being a little heavier than in decades past.
Historical data are available in Gallup Analytics.
Survey Methods
Results for this Gallup poll are based on telephone interviews conducted Nov. 9-13, 2016, with a random sample of 1,019 adults, aged 18 and older, living in all 50 U.S. states and the District of Columbia. For results based on the total sample of national adults, the margin of sampling error is ±4 percentage points at the 95% confidence level.
For results based on the sample of 530 men, the margin of sampling error is ±5 percentage points. For results based on the sample of 489 women, the margin of sampling error is ±5 percentage points.
All reported margins of sampling error include computed design effects for weighting.
Each sample of national adults includes a minimum quota of 60% cellphone respondents and 40% landline respondents, with additional minimum quotas by time zone within region. Landline and cellular telephone numbers are selected using random-digit-dial methods.
View complete question responses and trends.
Learn more about how the Gallup Poll Social Series works.


