
Story Highlights
- 23% of American workers are worried their benefits will be reduced
- 9% to 17% are worried about five other possible job setbacks
- Worries vary among demographic groups -- income is key
WASHINGTON, D.C. -- U.S. workers are largely unworried about six potential job setbacks as the nation's unemployment rate remains low. Less than a quarter of U.S. adults employed part or full time are concerned about possible layoffs, technological advances replacing their jobs, their employers moving overseas and reductions to their benefits, pay and hours.
Workers' levels of worry about these risks have been trending downward since 2014 after peaking during the Great Recession, when U.S. unemployment hit a high of 10%. As has been the case since 1997, when Gallup first asked this question, workers are most concerned that their benefits will be cut -- yet this year's 23% reading is the lowest on record. Likewise, American workers' concerns about the other five possibilities are currently at or near their lowest points.
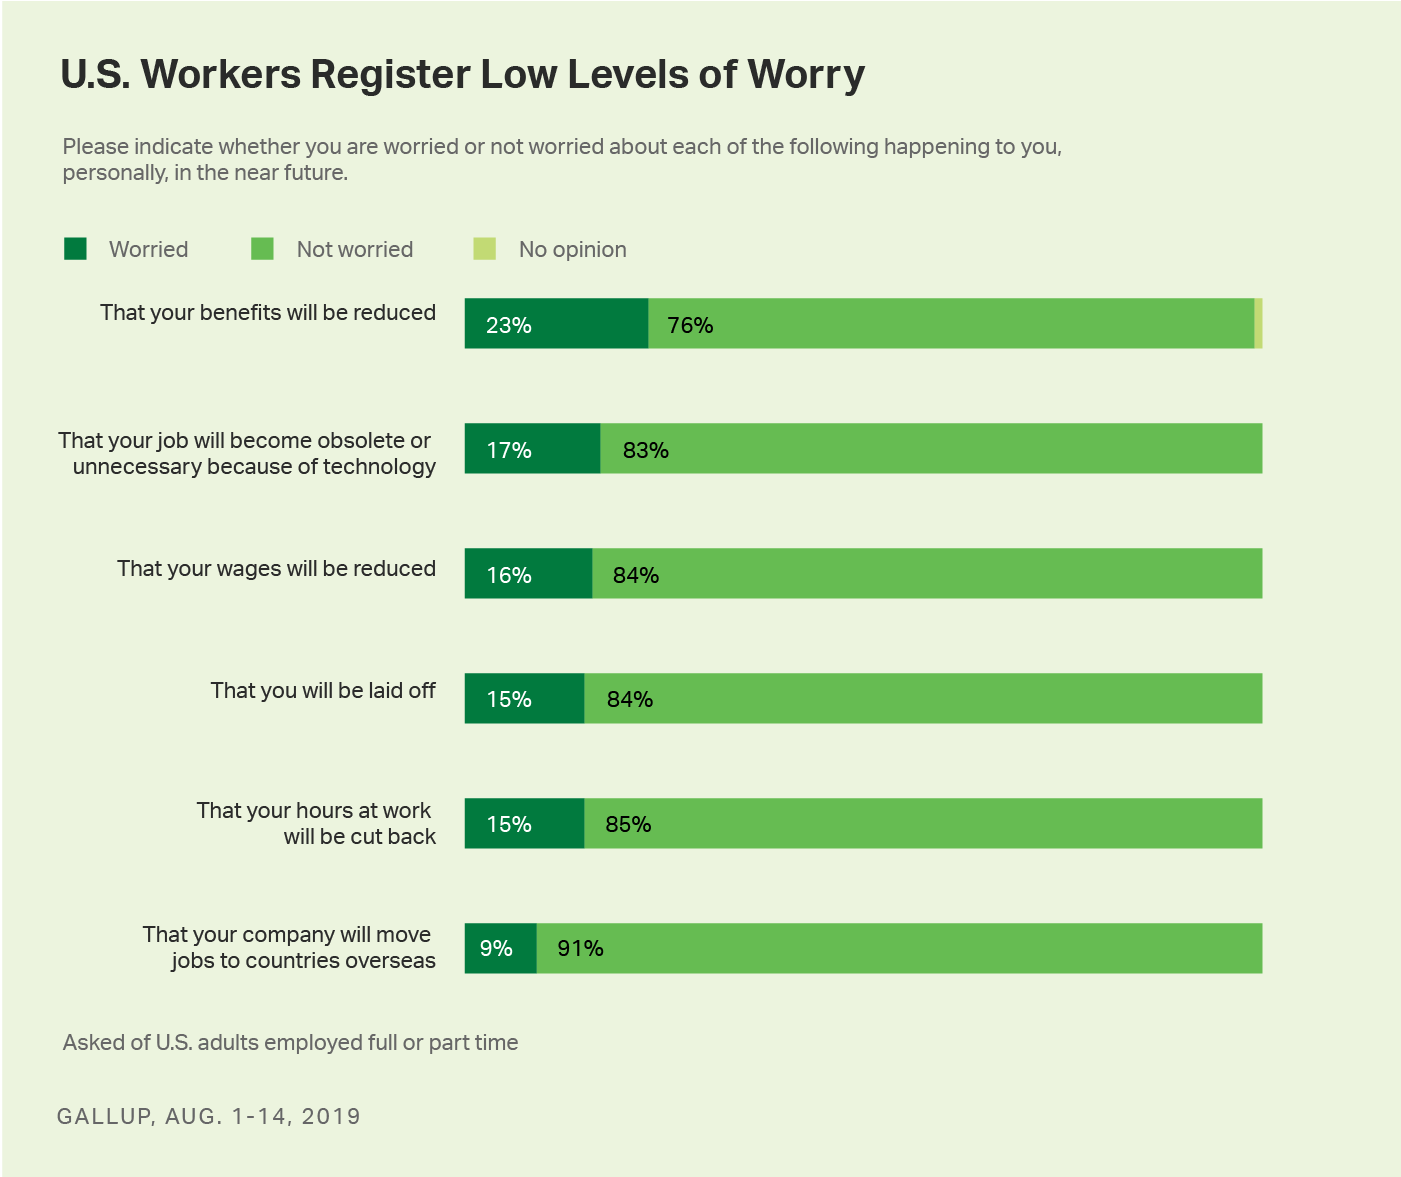
U.S. Workers Largely Unworried About Jobs
The latest data, from an Aug. 1-14 Gallup poll, show that behind their worry about benefits, workers are about equally worried that technology will eliminate their jobs (17%), their wages will be reduced (16%), they will be laid off (15%) and their hours will be cut (15%). Fewer are concerned about their company moving jobs overseas (9%).
Gallup has tracked worry about technology making workers' jobs obsolete or unnecessary annually since 2017, and more than four in five have consistently said they are not worried about it. The other five measures have been included in polling yearly since 2003. While roughly nine in 10 workers have steadily been unconcerned about their jobs being moved overseas, worry about the other four potential setbacks has fluctuated. The biggest spikes in worry for these four -- being laid off or having wages, benefits or hours reduced -- coincide with the Great Recession and its aftermath.
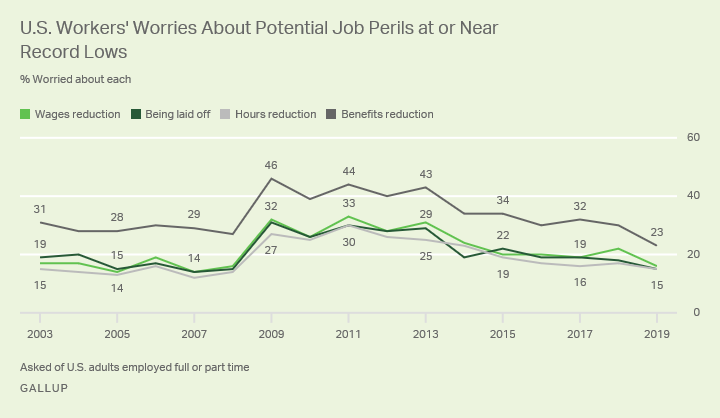
The latest 23% of workers who are worried about their benefits being reduced is the lowest on record for this measure; it was twice as high in 2009 during the economic downturn. The other three readings that have shown fluctuation (being laid off or having wages or hours reduced) are similarly now within three percentage points of the lowest levels of worry since 2003.
Demographic Differences in Levels of Worry
Workers' worries about job setbacks differ significantly among some key demographic groups. In general, the following groups of workers are more worried than their counterparts about job setbacks -- those with household incomes of less than $40,000 per year, those younger than 55, parents of children younger than 18, those in households without a labor union member, those without college degrees, those paid by the hour and blue-collar workers.
Among these groups, those with annual household incomes under $40,000 are the most worried about all of the potential job setbacks. Workers in this group are more likely to be paid hourly than by salary and to not have college degrees.
| Benefits reduction | Tech replacing jobs | Wages reduction | Being laid off | Hours reduction | Jobs moved overseas | |||||||||||||||||||||||||||||||||||||||||||||||||||||||||||||||||||||||||||||||||||||||||||||||
|---|---|---|---|---|---|---|---|---|---|---|---|---|---|---|---|---|---|---|---|---|---|---|---|---|---|---|---|---|---|---|---|---|---|---|---|---|---|---|---|---|---|---|---|---|---|---|---|---|---|---|---|---|---|---|---|---|---|---|---|---|---|---|---|---|---|---|---|---|---|---|---|---|---|---|---|---|---|---|---|---|---|---|---|---|---|---|---|---|---|---|---|---|---|---|---|---|---|---|---|---|
| % | % | % | % | % | % | |||||||||||||||||||||||||||||||||||||||||||||||||||||||||||||||||||||||||||||||||||||||||||||||
| Household income | ||||||||||||||||||||||||||||||||||||||||||||||||||||||||||||||||||||||||||||||||||||||||||||||||||||
| <$40,000 | 41 | 34 | 36 | 38 | 39 | 21 | ||||||||||||||||||||||||||||||||||||||||||||||||||||||||||||||||||||||||||||||||||||||||||||||
| $40,000-<$100,000 | 21 | 16 | 14 | 10 | 12 | 5 | ||||||||||||||||||||||||||||||||||||||||||||||||||||||||||||||||||||||||||||||||||||||||||||||
| $100,000+ | 15 | 9 | 6 | 7 | 3 | 5 | ||||||||||||||||||||||||||||||||||||||||||||||||||||||||||||||||||||||||||||||||||||||||||||||
| Age group | ||||||||||||||||||||||||||||||||||||||||||||||||||||||||||||||||||||||||||||||||||||||||||||||||||||
| 18-34 | 24 | 22 | 20 | 18 | 22 | 9 | ||||||||||||||||||||||||||||||||||||||||||||||||||||||||||||||||||||||||||||||||||||||||||||||
| 35-54 | 24 | 19 | 18 | 17 | 13 | 11 | ||||||||||||||||||||||||||||||||||||||||||||||||||||||||||||||||||||||||||||||||||||||||||||||
| 55+ | 18 | 6 | 7 | 7 | 7 | 2 | ||||||||||||||||||||||||||||||||||||||||||||||||||||||||||||||||||||||||||||||||||||||||||||||
| Parental status | ||||||||||||||||||||||||||||||||||||||||||||||||||||||||||||||||||||||||||||||||||||||||||||||||||||
| Have minor children | 28 | 22 | 21 | 20 | 18 | 13 | ||||||||||||||||||||||||||||||||||||||||||||||||||||||||||||||||||||||||||||||||||||||||||||||
| No minor children | 20 | 14 | 13 | 12 | 12 | 6 | ||||||||||||||||||||||||||||||||||||||||||||||||||||||||||||||||||||||||||||||||||||||||||||||
| Labor union status | ||||||||||||||||||||||||||||||||||||||||||||||||||||||||||||||||||||||||||||||||||||||||||||||||||||
| Union member in household | 17 | 12 | 5 | 8 | 4 | 5 | ||||||||||||||||||||||||||||||||||||||||||||||||||||||||||||||||||||||||||||||||||||||||||||||
| No union member | 24 | 18 | 19 | 17 | 16 | 9 | ||||||||||||||||||||||||||||||||||||||||||||||||||||||||||||||||||||||||||||||||||||||||||||||
| Education | ||||||||||||||||||||||||||||||||||||||||||||||||||||||||||||||||||||||||||||||||||||||||||||||||||||
| College degree | 19 | 11 | 10 | 9 | 5 | 4 | ||||||||||||||||||||||||||||||||||||||||||||||||||||||||||||||||||||||||||||||||||||||||||||||
| No college degree | 25 | 21 | 20 | 19 | 21 | 12 | ||||||||||||||||||||||||||||||||||||||||||||||||||||||||||||||||||||||||||||||||||||||||||||||
| Pay status | ||||||||||||||||||||||||||||||||||||||||||||||||||||||||||||||||||||||||||||||||||||||||||||||||||||
| Salaried | 19 | 10 | 12 | 9 | 4 | 6 | ||||||||||||||||||||||||||||||||||||||||||||||||||||||||||||||||||||||||||||||||||||||||||||||
| Hourly | 25 | 21 | 18 | 20 | 23 | 10 | ||||||||||||||||||||||||||||||||||||||||||||||||||||||||||||||||||||||||||||||||||||||||||||||
| Worker type | ||||||||||||||||||||||||||||||||||||||||||||||||||||||||||||||||||||||||||||||||||||||||||||||||||||
| White collar | 20 | 16 | 14 | 13 | 12 | 7 | ||||||||||||||||||||||||||||||||||||||||||||||||||||||||||||||||||||||||||||||||||||||||||||||
| Blue collar | 30 | 18 | 21 | 23 | 19 | 14 | ||||||||||||||||||||||||||||||||||||||||||||||||||||||||||||||||||||||||||||||||||||||||||||||
| GALLUP, Aug. 1-14, 2019 | ||||||||||||||||||||||||||||||||||||||||||||||||||||||||||||||||||||||||||||||||||||||||||||||||||||
Learn more about how the Gallup Poll Social Series works.