Story Highlights
- Americans less pessimistic about the crisis than in early April
- More now expect disruption to continue through 2020 or beyond
WASHINGTON, D.C. -- Recent shifts in Americans' views on the coronavirus situation align with new evidence that there has been a flattening of the infection curve at the national level, including positive news about declining cases in the U.S. epicenter of the crisis, New York City.
Roughly equal proportions of Americans say the situation is getting better as perceive it is getting worse, a continuation of the shift recorded a week ago. At the same time, an expanding minority expect the disruption caused by the coronavirus to continue for the rest of 2020 or longer, while a dwindling share say things will start to improve in a matter of weeks.
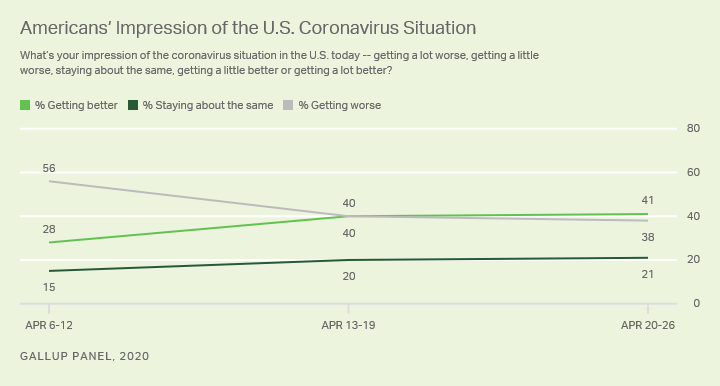
The Glass Is Now 'Half Full'
The percentage of Americans saying the coronavirus situation is getting worse is now down to 38%, from 56% in early April. In fact, a slight plurality (41%) in Gallup polling from April 20-26 say conditions are improving, while another 21% think they are stable.
These findings are based on nationally representative web surveys of U.S. adults using the Gallup Panel.
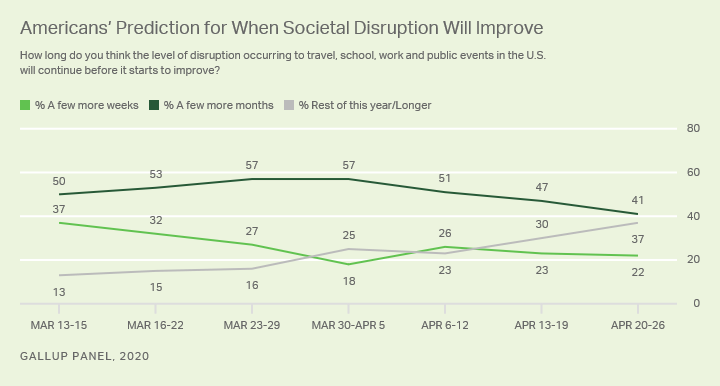
Nearly Four in 10 Americans Expect Disruption to Last All Year or Longer
At the same time, Americans anticipate that the nation's return to "normal" may be a longer, slower process than first imagined. This may have sunk in for many as governors across the country outlined steps for reopening their states on a gradual basis, with careful monitoring of the illness and the reinstatement of stricter social distancing measures if necessary. Meanwhile, other states have extended stay-at-home orders for several weeks.
When asked how long they think the "disruption occurring to travel, school, work and public events in the U.S. will continue before it begins to improve," 13% of Americans in Gallup's first tracking period (from March 13-15) imagined that it would last for the rest of this year or longer. That figure inched up to 25% by the week of March 30-April 5, to 30% by April 13-19 -- and stands at 37% now.
Meanwhile, the percentage of Americans predicting that this level of disruption will continue for only a few more weeks has declined by 15 percentage points, from 37% to 22%. Those expecting it to last a few more months is down nine points, from 50% to 41%.
Only 1% Say Their Life Has Not Been Disrupted at All
Since Gallup's first reading on the subject, in mid-March, a majority of Americans have said their own life has been affected or disrupted a "great deal" or "fair amount" by the coronavirus situation. That percentage quickly peaked at 80% at the start of April and has remained high, although it's recently eased to 72%.
The percentage of Americans reporting no disruption to their life has been in the single digits throughout the crisis but is now a mere 1%, with another 26% reporting "not much" disruption.
| A great deal | A fair amount | Not much | Not at all | ||||||||||||||||||||||||||||||||||||||||||||||||||||||||||||||||||||||||||||||||||||||||||||||||
|---|---|---|---|---|---|---|---|---|---|---|---|---|---|---|---|---|---|---|---|---|---|---|---|---|---|---|---|---|---|---|---|---|---|---|---|---|---|---|---|---|---|---|---|---|---|---|---|---|---|---|---|---|---|---|---|---|---|---|---|---|---|---|---|---|---|---|---|---|---|---|---|---|---|---|---|---|---|---|---|---|---|---|---|---|---|---|---|---|---|---|---|---|---|---|---|---|---|---|---|
| % | % | % | % | ||||||||||||||||||||||||||||||||||||||||||||||||||||||||||||||||||||||||||||||||||||||||||||||||
| Mar 13-15 | 18 | 37 | 36 | 8 | |||||||||||||||||||||||||||||||||||||||||||||||||||||||||||||||||||||||||||||||||||||||||||||||
| Mar 16-22 | 32 | 43 | 22 | 3 | |||||||||||||||||||||||||||||||||||||||||||||||||||||||||||||||||||||||||||||||||||||||||||||||
| Mar 23-29 | 33 | 45 | 21 | 2 | |||||||||||||||||||||||||||||||||||||||||||||||||||||||||||||||||||||||||||||||||||||||||||||||
| Mar 30-Apr 5 | 35 | 45 | 18 | 2 | |||||||||||||||||||||||||||||||||||||||||||||||||||||||||||||||||||||||||||||||||||||||||||||||
| Apr 6-12 | 34 | 46 | 18 | 2 | |||||||||||||||||||||||||||||||||||||||||||||||||||||||||||||||||||||||||||||||||||||||||||||||
| Apr 13-19 | 29 | 46 | 23 | 2 | |||||||||||||||||||||||||||||||||||||||||||||||||||||||||||||||||||||||||||||||||||||||||||||||
| Apr 20-26 | 27 | 45 | 26 | 1 | |||||||||||||||||||||||||||||||||||||||||||||||||||||||||||||||||||||||||||||||||||||||||||||||
| Gallup Panel, 2020 | |||||||||||||||||||||||||||||||||||||||||||||||||||||||||||||||||||||||||||||||||||||||||||||||||||
Few U.S. adults in any region claim to be "not at all" affected by the crisis, and there is little regional variation in those affected either a fair amount or a great deal. The rate is 74% in the Northeast region, compared with 72% in the Midwest, 72% in the South and 72% in the West.
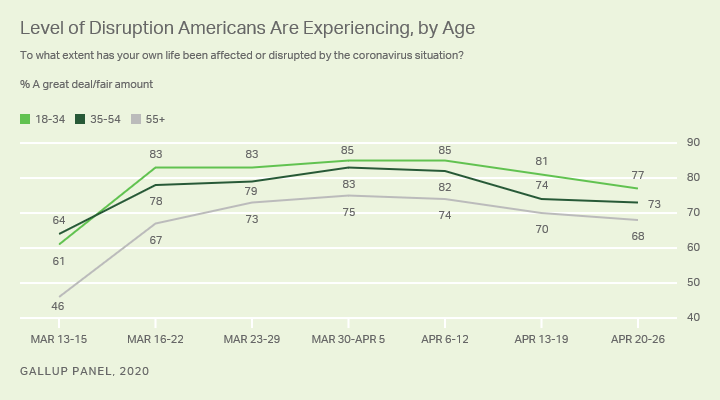
Generational Gap in COVID-19 Disruption Shrinks
While older Americans were a bit slower to feel affected by the crisis, the pandemic has not spared any age group when it comes to disruption to their lives. In mid-March, about six in 10 adults in the 18-to-34 and 35-to-54 age groups said their lives were disrupted a great deal or fair amount by the situation. By contrast, just under half of those aged 55 and older (46%) said the same. Since then, self-reported disruption has jumped 22 points (to 68%) among the older group, increased 16 points (to 77%) among the youngest group, and risen nine points (to 73%) among the middle-aged group.
As a result, older Americans are now only slightly less likely than younger Americans to say their lives have been disrupted, a change from the early weeks of the crisis when the gap was wider.
As Americans look to what's next, their perception of whether the situation is improving or worsening varies by gender, age, the area they live in and other characteristics.
While all groups have become less pessimistic about the direction of the crisis, men, adults aged 55 and older, and residents of small towns and rural areas are decidedly more optimistic than pessimistic in their outlook, while adults aged 18 to 34 and city residents still lean decidedly pessimistic.
Most other groups are more mixed in their views; however, the starkest differences are seen by political party. Nearly three-quarters of Republicans say the situation is improving, while the majority of Democrats say it's getting worse.
| Getting better | Getting worse | Net "Getting better" | ||||||||||||||||||||||||||||||||||||||||||||||||||||||||||||||||||||||||||||||||||||||||||||||||||
|---|---|---|---|---|---|---|---|---|---|---|---|---|---|---|---|---|---|---|---|---|---|---|---|---|---|---|---|---|---|---|---|---|---|---|---|---|---|---|---|---|---|---|---|---|---|---|---|---|---|---|---|---|---|---|---|---|---|---|---|---|---|---|---|---|---|---|---|---|---|---|---|---|---|---|---|---|---|---|---|---|---|---|---|---|---|---|---|---|---|---|---|---|---|---|---|---|---|---|---|---|
| % | % | pct. pts. | ||||||||||||||||||||||||||||||||||||||||||||||||||||||||||||||||||||||||||||||||||||||||||||||||||
| Gender | ||||||||||||||||||||||||||||||||||||||||||||||||||||||||||||||||||||||||||||||||||||||||||||||||||||
| Men | 46 | 36 | +10 | |||||||||||||||||||||||||||||||||||||||||||||||||||||||||||||||||||||||||||||||||||||||||||||||||
| Women | 36 | 40 | -4 | |||||||||||||||||||||||||||||||||||||||||||||||||||||||||||||||||||||||||||||||||||||||||||||||||
| Age | ||||||||||||||||||||||||||||||||||||||||||||||||||||||||||||||||||||||||||||||||||||||||||||||||||||
| 18-34 | 29 | 48 | -19 | |||||||||||||||||||||||||||||||||||||||||||||||||||||||||||||||||||||||||||||||||||||||||||||||||
| 35-54 | 42 | 34 | +8 | |||||||||||||||||||||||||||||||||||||||||||||||||||||||||||||||||||||||||||||||||||||||||||||||||
| 55+ | 48 | 34 | +14 | |||||||||||||||||||||||||||||||||||||||||||||||||||||||||||||||||||||||||||||||||||||||||||||||||
| Household income | ||||||||||||||||||||||||||||||||||||||||||||||||||||||||||||||||||||||||||||||||||||||||||||||||||||
| <$36,000 | 33 | 41 | -8 | |||||||||||||||||||||||||||||||||||||||||||||||||||||||||||||||||||||||||||||||||||||||||||||||||
| $36,000-<$90,000 | 42 | 38 | +4 | |||||||||||||||||||||||||||||||||||||||||||||||||||||||||||||||||||||||||||||||||||||||||||||||||
| $90,000+ | 42 | 37 | +5 | |||||||||||||||||||||||||||||||||||||||||||||||||||||||||||||||||||||||||||||||||||||||||||||||||
| Area live in | ||||||||||||||||||||||||||||||||||||||||||||||||||||||||||||||||||||||||||||||||||||||||||||||||||||
| City | 34 | 45 | -11 | |||||||||||||||||||||||||||||||||||||||||||||||||||||||||||||||||||||||||||||||||||||||||||||||||
| Suburb | 38 | 39 | -1 | |||||||||||||||||||||||||||||||||||||||||||||||||||||||||||||||||||||||||||||||||||||||||||||||||
| Small town/Rural area | 48 | 32 | +16 | |||||||||||||||||||||||||||||||||||||||||||||||||||||||||||||||||||||||||||||||||||||||||||||||||
| U.S. region | ||||||||||||||||||||||||||||||||||||||||||||||||||||||||||||||||||||||||||||||||||||||||||||||||||||
| Northeast | 39 | 40 | -1 | |||||||||||||||||||||||||||||||||||||||||||||||||||||||||||||||||||||||||||||||||||||||||||||||||
| Midwest | 40 | 35 | +5 | |||||||||||||||||||||||||||||||||||||||||||||||||||||||||||||||||||||||||||||||||||||||||||||||||
| South | 42 | 37 | +5 | |||||||||||||||||||||||||||||||||||||||||||||||||||||||||||||||||||||||||||||||||||||||||||||||||
| West | 41 | 39 | +2 | |||||||||||||||||||||||||||||||||||||||||||||||||||||||||||||||||||||||||||||||||||||||||||||||||
| Party ID | ||||||||||||||||||||||||||||||||||||||||||||||||||||||||||||||||||||||||||||||||||||||||||||||||||||
| Democrats | 22 | 55 | -33 | |||||||||||||||||||||||||||||||||||||||||||||||||||||||||||||||||||||||||||||||||||||||||||||||||
| Independents | 35 | 42 | -7 | |||||||||||||||||||||||||||||||||||||||||||||||||||||||||||||||||||||||||||||||||||||||||||||||||
| Republicans | 73 | 11 | +62 | |||||||||||||||||||||||||||||||||||||||||||||||||||||||||||||||||||||||||||||||||||||||||||||||||
| Gallup Panel, April 20-26, 2020 | ||||||||||||||||||||||||||||||||||||||||||||||||||||||||||||||||||||||||||||||||||||||||||||||||||||
Bottom Line
As the global COVID-19 death toll passes 225,000 and exceeds 3 million cases worldwide, experts' discourse about how to best combat the virus means that vocabulary otherwise left to scientists and public health officials is finding its way into American homes and conversations. With that, the term "flattening the curve" has become part of everyday life.
In epidemiological terms, flattening the curve means trading a crisis of relatively short duration for a manageable challenge extending over a longer time frame. The simultaneous increase in public optimism about the severity of the coronavirus situation and greater public understanding that disruption is here to stay is entirely compatible with this strategy starting to work at the national level. However, if community openings result in a second wave of cases, as some predict, we can expect Americans' attitudes about progress on COVID-19 to sour accordingly.
Learn more about how the Gallup Panel works.