Story Highlights
- Record-high percentage want marijuana legalized
- Majorities of many key demographic groups support legalization
- Less than half Republicans, conservatives, weekly churchgoers support it
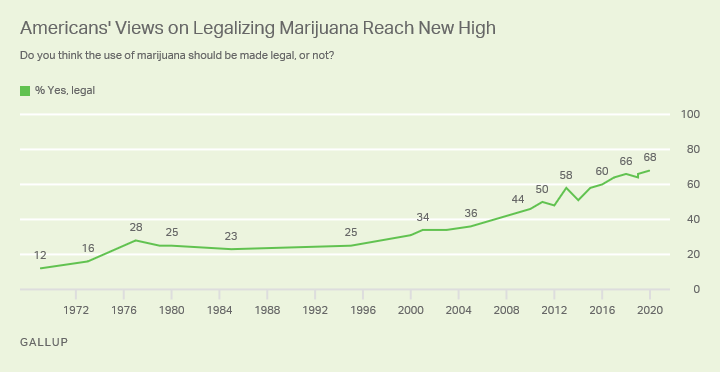
WASHINGTON, D.C. -- Americans are more likely now than at any point in the past five decades to support the legalization of marijuana in the U.S. The 68% of U.S. adults who currently back the measure is not statistically different from last year's 66%; however, it is nominally Gallup's highest reading, exceeding the 64% to 66% range seen from 2017 to 2019.

Line chart. Americans' support for the legalization of marijuana since 1969. Currently, 68% of Americans favor legalizing marijuana, up from 12% in 1969.
Gallup first measured the public's views of marijuana legalization in 1969, when 12% of Americans backed it; by 1977, support had more than doubled to 28%. It did not exceed 30% until 2000 but has risen steeply in the two decades since then, and is now twice what it was in 2001 and 2003.
The latest data are from a Sept. 30-Oct. 15 poll, conducted before the election that saw marijuana legalization proposals on the ballot in several states. Voters in all of these states -- Arizona, Montana, New Jersey, and South Dakota -- authorized the legal use of recreational marijuana in the Nov. 3 election. They join 11 other states and the District of Columbia in legalizing pot for recreational purposes. Additionally, voters in Mississippi and South Dakota join 33 states and the District of Columbia in passing laws legalizing or decriminalizing the use of marijuana for medicinal purposes.
Many Key Demographic Groups Support Legalization
Majorities of most demographic subgroups of Americans support legalizing marijuana, including by gender, age, education and household income. Yet there is considerable variation in the extent of support within each group, as men, younger adults, college graduates and those in households with incomes of at least $100,000 are more likely than their counterparts to favor legalization.
| Yes, legal | No, not legal | |||||||||||||||||||||||||||||||||||||||||||||||||||||||||||||||||||||||||||||||||||||||||||||||||||
|---|---|---|---|---|---|---|---|---|---|---|---|---|---|---|---|---|---|---|---|---|---|---|---|---|---|---|---|---|---|---|---|---|---|---|---|---|---|---|---|---|---|---|---|---|---|---|---|---|---|---|---|---|---|---|---|---|---|---|---|---|---|---|---|---|---|---|---|---|---|---|---|---|---|---|---|---|---|---|---|---|---|---|---|---|---|---|---|---|---|---|---|---|---|---|---|---|---|---|---|---|
| % | % | |||||||||||||||||||||||||||||||||||||||||||||||||||||||||||||||||||||||||||||||||||||||||||||||||||
| Gender | ||||||||||||||||||||||||||||||||||||||||||||||||||||||||||||||||||||||||||||||||||||||||||||||||||||
| Male | 69 | 30 | ||||||||||||||||||||||||||||||||||||||||||||||||||||||||||||||||||||||||||||||||||||||||||||||||||
| Female | 66 | 34 | ||||||||||||||||||||||||||||||||||||||||||||||||||||||||||||||||||||||||||||||||||||||||||||||||||
| Age group | ||||||||||||||||||||||||||||||||||||||||||||||||||||||||||||||||||||||||||||||||||||||||||||||||||||
| 18-29 | 79 | 21 | ||||||||||||||||||||||||||||||||||||||||||||||||||||||||||||||||||||||||||||||||||||||||||||||||||
| 30-49 | 75 | 24 | ||||||||||||||||||||||||||||||||||||||||||||||||||||||||||||||||||||||||||||||||||||||||||||||||||
| 50-64 | 60 | 39 | ||||||||||||||||||||||||||||||||||||||||||||||||||||||||||||||||||||||||||||||||||||||||||||||||||
| 65+ | 55 | 45 | ||||||||||||||||||||||||||||||||||||||||||||||||||||||||||||||||||||||||||||||||||||||||||||||||||
| Education | ||||||||||||||||||||||||||||||||||||||||||||||||||||||||||||||||||||||||||||||||||||||||||||||||||||
| Not college grad | 64 | 36 | ||||||||||||||||||||||||||||||||||||||||||||||||||||||||||||||||||||||||||||||||||||||||||||||||||
| College grad | 76 | 24 | ||||||||||||||||||||||||||||||||||||||||||||||||||||||||||||||||||||||||||||||||||||||||||||||||||
| Household income | ||||||||||||||||||||||||||||||||||||||||||||||||||||||||||||||||||||||||||||||||||||||||||||||||||||
| Less than $40,000 | 67 | 33 | ||||||||||||||||||||||||||||||||||||||||||||||||||||||||||||||||||||||||||||||||||||||||||||||||||
| $40,000-100,000 | 68 | 31 | ||||||||||||||||||||||||||||||||||||||||||||||||||||||||||||||||||||||||||||||||||||||||||||||||||
| $100,000+ | 74 | 26 | ||||||||||||||||||||||||||||||||||||||||||||||||||||||||||||||||||||||||||||||||||||||||||||||||||
| GALLUP, Sept. 30-Oct. 15, 2020 | ||||||||||||||||||||||||||||||||||||||||||||||||||||||||||||||||||||||||||||||||||||||||||||||||||||
Republicans, Conservatives and Weekly Churchgoers Remain Holdouts
Most politically left-leaning and middle-of-the-road Americans remain supportive of legalizing marijuana, while less than half of those who lean right favor it. Over eight in 10 Democrats and liberals, and more than seven in 10 independents and moderates, back legalization, but just under half of Republicans and conservatives do.
Views of legalization also differ greatly depending on frequency of attendance at religious services. A slim majority of those who say they attend weekly oppose legalization. Yet, about three in five of those who attend nearly weekly or monthly, and about four in five who attend less frequently, favor legalizing marijuana.
| Yes, legal | No, not legal | |||||||||||||||||||||||||||||||||||||||||||||||||||||||||||||||||||||||||||||||||||||||||||||||||||
|---|---|---|---|---|---|---|---|---|---|---|---|---|---|---|---|---|---|---|---|---|---|---|---|---|---|---|---|---|---|---|---|---|---|---|---|---|---|---|---|---|---|---|---|---|---|---|---|---|---|---|---|---|---|---|---|---|---|---|---|---|---|---|---|---|---|---|---|---|---|---|---|---|---|---|---|---|---|---|---|---|---|---|---|---|---|---|---|---|---|---|---|---|---|---|---|---|---|---|---|---|
| % | % | |||||||||||||||||||||||||||||||||||||||||||||||||||||||||||||||||||||||||||||||||||||||||||||||||||
| Party identification | ||||||||||||||||||||||||||||||||||||||||||||||||||||||||||||||||||||||||||||||||||||||||||||||||||||
| Republican | 48 | 52 | ||||||||||||||||||||||||||||||||||||||||||||||||||||||||||||||||||||||||||||||||||||||||||||||||||
| Independents | 72 | 27 | ||||||||||||||||||||||||||||||||||||||||||||||||||||||||||||||||||||||||||||||||||||||||||||||||||
| Democratic | 83 | 16 | ||||||||||||||||||||||||||||||||||||||||||||||||||||||||||||||||||||||||||||||||||||||||||||||||||
| Political ideology | ||||||||||||||||||||||||||||||||||||||||||||||||||||||||||||||||||||||||||||||||||||||||||||||||||||
| Conservative | 49 | 50 | ||||||||||||||||||||||||||||||||||||||||||||||||||||||||||||||||||||||||||||||||||||||||||||||||||
| Moderate | 74 | 26 | ||||||||||||||||||||||||||||||||||||||||||||||||||||||||||||||||||||||||||||||||||||||||||||||||||
| Liberal | 87 | 13 | ||||||||||||||||||||||||||||||||||||||||||||||||||||||||||||||||||||||||||||||||||||||||||||||||||
| Religious service attendance | ||||||||||||||||||||||||||||||||||||||||||||||||||||||||||||||||||||||||||||||||||||||||||||||||||||
| Weekly | 48 | 52 | ||||||||||||||||||||||||||||||||||||||||||||||||||||||||||||||||||||||||||||||||||||||||||||||||||
| Nearly weekly/Monthly | 59 | 39 | ||||||||||||||||||||||||||||||||||||||||||||||||||||||||||||||||||||||||||||||||||||||||||||||||||
| Less often | 79 | 20 | ||||||||||||||||||||||||||||||||||||||||||||||||||||||||||||||||||||||||||||||||||||||||||||||||||
| GALLUP, Sept. 30-Oct. 15, 2020 | ||||||||||||||||||||||||||||||||||||||||||||||||||||||||||||||||||||||||||||||||||||||||||||||||||||
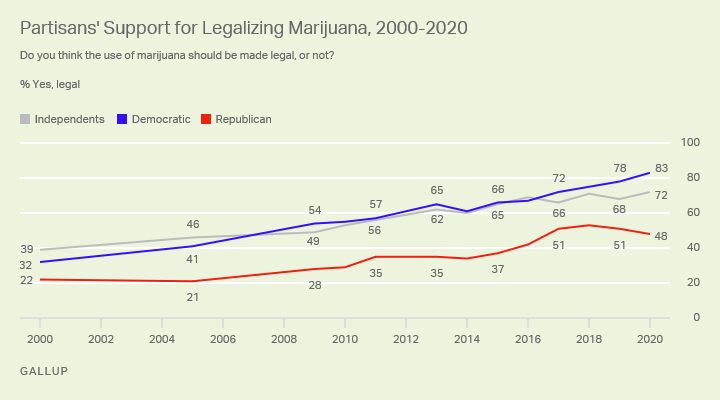
The 83% of Democrats and 72% of independents who prefer legalization are the highest readings in the trend for both groups, but Republicans' current 48% is down slightly from slim majorities in 2017, 2018 and 2019.

Line chart. Partisans' support for marijuana legalization since 2000. Currently, 83% of Democrats, 72% of independents and 48% of Republicans favor legalizing marijuana, up from 32%, 39% and 22%, respectively, in 2000.
Bottom Line
Since 2012, when Colorado and Washington became the first states to legalize recreational marijuana, there has been a slow trickle of states that have followed suit. Over that period, Americans' support for marijuana legalization has risen 20 points to a record-high 68%. This measure has enjoyed majority support from the public since 2013. Additionally, Gallup data from earlier this year find that 70% of U.S. adults now consider smoking marijuana to be morally acceptable, marking a five-percentage-point uptick in one year.
The trajectory of the public's support for the legalization of marijuana has coincided with an increasing number of states approving it. It is not entirely clear whether the shift in public opinion has caused the change in many state laws or vice versa. Given recent trends, more states are likely to legalize recreational marijuana in the future. Considering the high level of public support for such a measure, a change in federal policy could even occur.
View complete question responses and trends (PDF download).
Learn more about how the Gallup Poll Social Series works.


