
Story Highlights
- 58% dissatisfied with level of immigration into the U.S.; 34% satisfied
- 35% of U.S. adults are dissatisfied, want level to decrease; 9%, to increase
- New 69% high of Republicans want less immigration
WASHINGTON, D.C. -- Nearly six in 10 Americans, 58%, are dissatisfied with the level of immigration into the U.S. today, while 34% are satisfied. This marks an eight-percentage-point increase in dissatisfaction since last year and a return to the 2019-2020 range.
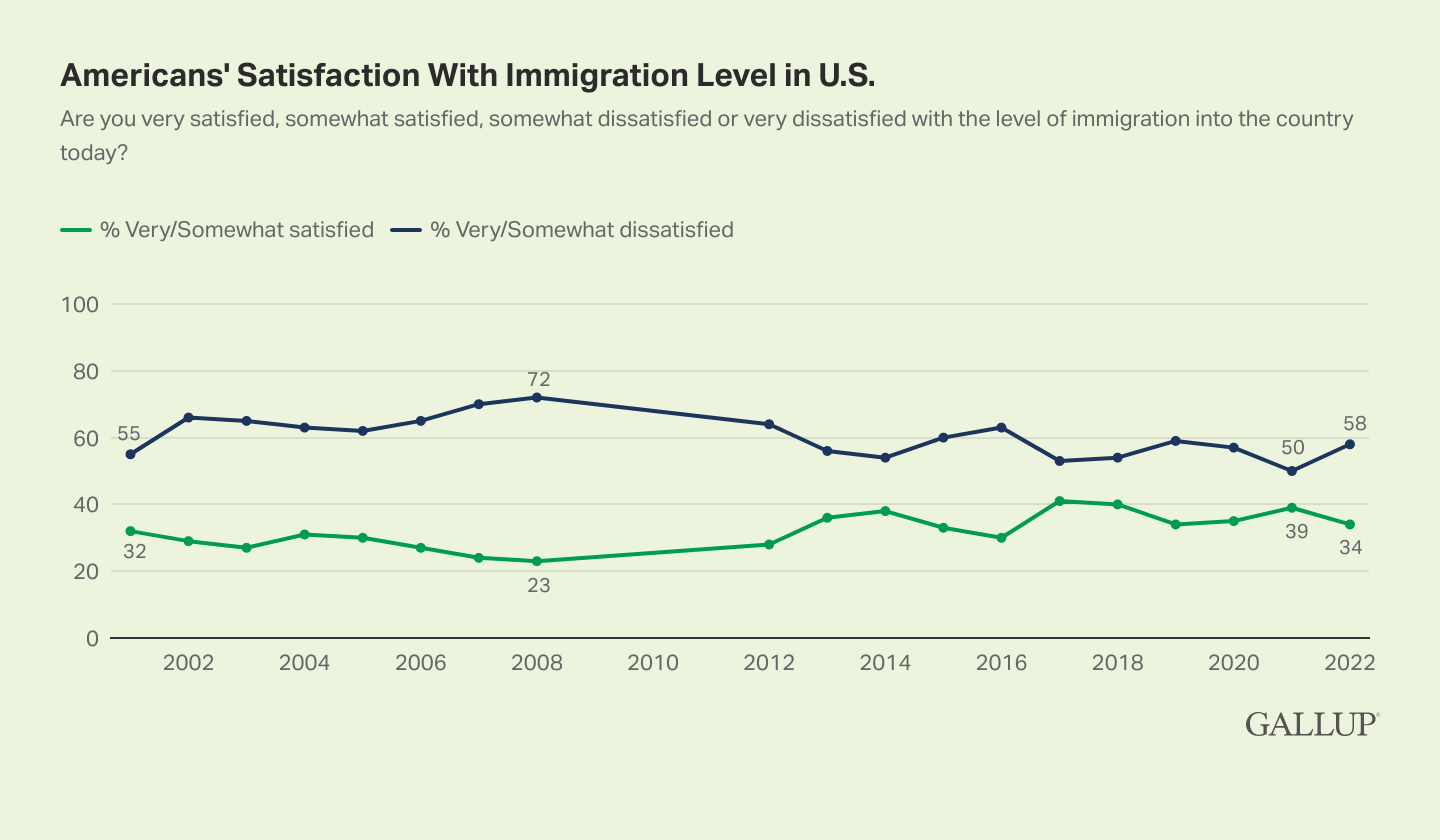
Line graph. Percentages of Americans who are satisfied with the level of immigration into the U.S. today, from 2001-2022. Currently, 58% are dissatisfied and 34% are satisfied. Dissatisfaction has been higher than satisfaction in all years but is now lower than the 72% recorded in 2008.
The 58% dissatisfied includes 35% of all Americans who would prefer that immigration be decreased, 9% increased, and 14% who want levels kept the same. Last year, those dissatisfied were about equally as likely to favor an increase as a decrease, but now the predominant view among the dissatisfied is for less immigration. The proportion who want less immigration has nearly doubled from 19% in 2021 and is well above where it was in 2019 (23%) and 2020 (25%). At the same time, calls for more immigration into the country have dropped.
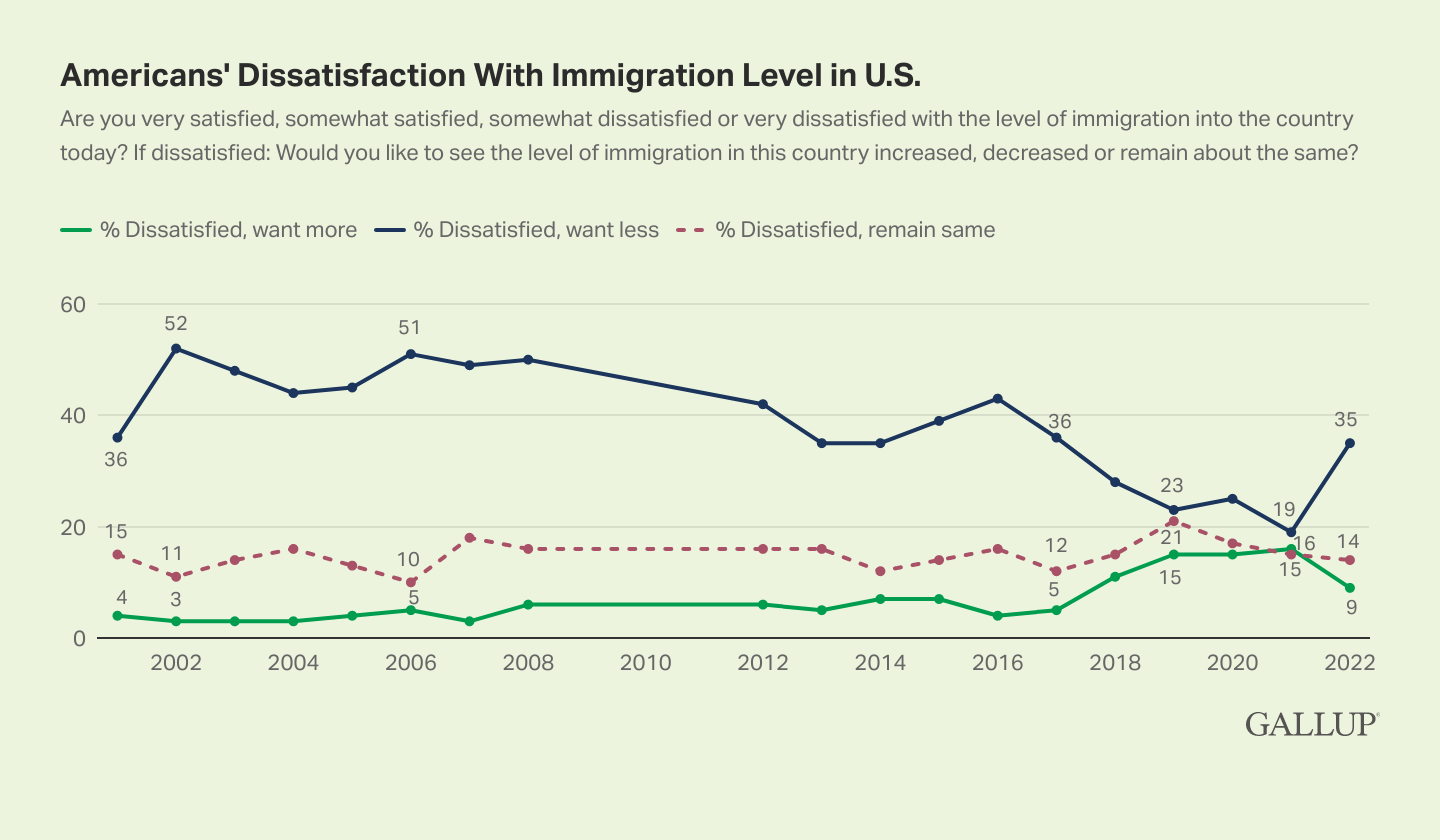
Line graph. Percentages of Americans who are dissatisfied with the level of immigration into the U.S. today from 2001-2022. The graph shows the percentages of U.S. adults who are dissatisfied and 1) want less immigration, 2) want more immigration and 3) want it to remain the same. Currently, the 58% who are dissatisfied includes 35% of all Americans who would prefer that immigration be decreased, 6% increased, and 14% want no change in the level. Historically, the highest percentage calling for decreased immigration was 52% in 2002.
These latest data are from Gallup's Jan. 3-16 Mood of the Nation poll, which has tracked this immigration measure since 2001, with the exception of 2009 through 2011. In his first year in office, President Joe Biden reversed some of his predecessor Donald Trump's measures limiting immigration into the U.S., but Biden's attempts at getting significant immigration reform legislation through Congress have failed.
Additionally, Biden has drawn criticism from both sides of the aisle for his border policy, and his approval ratings for handling immigration have been more negative than positive, with declining approval from Democrats.
Republicans' Dissatisfaction With U.S. Immigration Level at Highest Point
Record-high dissatisfaction among Republicans is largely driving the overall rise in dissatisfaction with immigration levels in the U.S. Since last year, spanning the change from the Trump to the Biden administration, Republicans' dissatisfaction has grown from 55% to 87%. The current figure is three points above the previous high recorded in 2015, the last time a Democrat occupied the White House.
In the past year, independents' dissatisfaction has risen six points to 55%; however, it remains much lower than the 72% peak for this group in 2007 and 2008.
For their part, Democrats' current 40% dissatisfaction reading has fallen seven points in the past year and 14 points since 2020. Fifty-two percent of Democrats are now satisfied with immigration levels in the U.S., which is only the third time dating back to 2001 that more than half of Democrats have been satisfied. The previous two were 65% in 2017, just before Trump was inaugurated, and 53% in 2014.
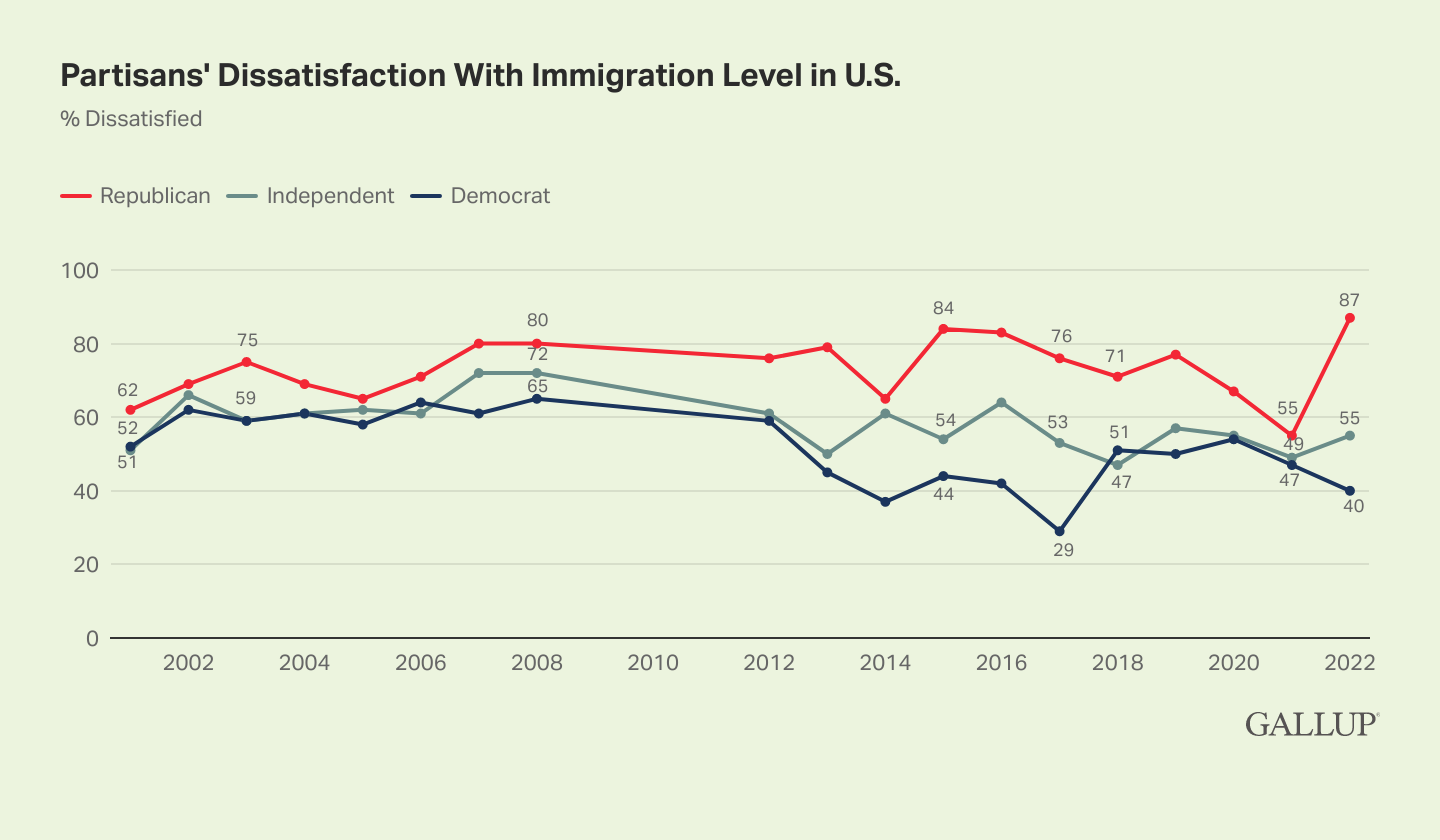
Line graph. Percentages of partisans who are dissatisfied with the level of immigration into the U.S. today from 2001-2022. Currently, 87% of Republicans, 55% of independents and 40% of Democrats are dissatisfied. Republicans' dissatisfaction has risen 32 points and independents' six points since last year, while Democrats' dissatisfaction is down seven points.
The vast majority of Republicans are dissatisfied with immigration and would like to see it decreased (69%), while 15% do not express a preference and 3% favor it being increased. While a majority of Democrats are satisfied with immigration, those who are dissatisfied are about evenly divided in their preferences for each of the three options. Dissatisfied independents are more than three times as likely to say they would like it to be decreased rather than increased.
| Satisfied | Dissatisfied, should be increased | Dissatisfied, should be decreased | Dissatisfied, no preference | |
|---|---|---|---|---|
| % | % | % | % | |
| Republican | ||||
| 2022 | 11 | 3 | 69 | 15 |
| 2021 | 39 | 2 | 40 | 13 |
| 2020 | 28 | 7 | 45 | 15 |
| Independent | ||||
| 2022 | 34 | 9 | 32 | 14 |
| 2021 | 41 | 14 | 19 | 15 |
| 2020 | 37 | 13 | 23 | 18 |
| Democrat | ||||
| 2022 | 52 | 15 | 11 | 14 |
| 2021 | 39 | 28 | 2 | 17 |
| 2020 | 36 | 28 | 10 | 16 |
| gallup | ||||
Bottom Line
After hitting a record-low 50% last year, Americans' dissatisfaction with the level of immigration into the U.S. has returned to the majority level. This rise in dissatisfaction is driven mostly by Republicans, likely unhappy with the shift in immigration policy that has occurred between the Trump and Biden administrations. Republicans who are dissatisfied overwhelmingly favor decreasing the immigration level. While Biden has rolled back some of Trump's restrictive immigration policies, and Democrats' satisfaction has risen in the past year, to 52%, this is more modest than the change in the other direction among Republicans. Biden has work to do to improve his party's view of immigration in the U.S.
To stay up to date with the latest Gallup News insights and updates, follow us on Twitter.
Learn more about how the Gallup Poll Social Series works.