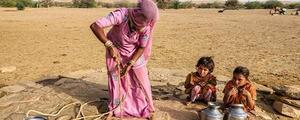
Diet -- the food people eat -- is a central component of wellbeing. It reflects the sum of what society provides and an individual's circumstances, which either support or hamper the consumption of nourishing food. This centrality of diet to wellbeing is reflected in health statistics: Poor diet and malnutrition are estimated to be the two top risk factors within the global burden of disease.[1]
Yet most countries lack routine, current, comparable data on what people eat. Situations such as the recent COVID-19 pandemic show how vitally useful it would be to have routinely collected data on what people are eating, and how their diets shift because of shocks and over time. Unlike most other public health priorities such as HIV, smoking and obesity, there is no global monitoring system for diets.
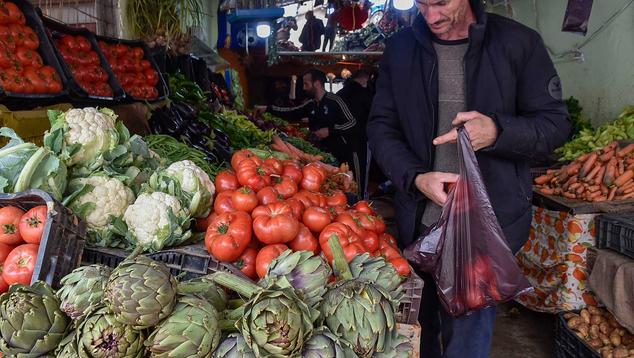
Not only is it important to ask, "Is the bowl full or empty?" but also, "What's in the bowl?"
Over the past several years, Gallup has changed the landscape of food security information by partnering with the Food and Agriculture Organization of the United Nations to collect the Food Insecurity Experience Scale (FIES). FIES has since been featured in the United Nations State of Food Security and Nutrition in the World reports and adopted by national governments in over 100 countries.
Now, Gallup is partnering with Harvard University and the Global Alliance for Improved Nutrition (GAIN) to pioneer the global measurement of diet quality with the Global Diet Quality Project. Not only is it important to ask, "Is the bowl full or empty?" but also, "What's in the bowl?"
Enter the Global Diet Quality Project
The Global Diet Quality Project will generate both the data and tools to enable routine, valid and comparable diet data collection across countries. The Gallup World Poll will collect an initial round of diet-quality data in 40 countries in 2021, with financing from The Swiss Agency for Development and Cooperation and The Rockefeller Foundation.
Our Diet Quality Questionnaire (DQ-Q) itself takes just five minutes to implement, yet it provides a host of information about diet patterns at the population level.[2] The questions capture consumption information for 29 food groups, including both healthy and unhealthy foods. Data on population-level trends in specific food groups -- such as the proportion of people consuming fruits and vegetables, or the proportion consuming fast food or sodas -- are interesting in themselves. The data can also be used to create summary indicators of diet quality.
Alongside the DQ-Q, we have developed a suite of indicators that reflect global dietary recommendations, such as the World Health Organization recommendation to consume at least 400 g of fruits and vegetables each day; and to consume less than 10% of dietary energy from free sugars.[3] Furthermore, dietary diversity scores are readily available from the data, including the minimum dietary diversity for women of reproductive age (MDD-W).[4]
Early Results From Ghana and Tanzania
DQ-Q data collected last year in Ghana and Tanzania yielded some intriguing results. In addition to providing basic current diet information (the last national diet survey in Ghana was carried out in 1976), the data revealed differences between genders, socioeconomic groups, and urban/rural areas within countries.
-
Less than half (48%) of adults in Tanzania and Ghana are consuming diets that minimally resemble dietary guidelines: daily consumption of at least some vegetables, fruits and protein-rich foods, in addition to starchy staple foods.*
-
Gender disparities were apparent in Tanzania but not Ghana. In Tanzania, a significantly lower proportion of women than men consumed animal-source foods, protein-rich foods, and pulses, nuts, and seeds. On the whole, women's diets were less diverse than men's, and they met fewer global recommendations on healthy foods.[5] While other surveys focus on dietary diversity among women only, information on men and women is crucial to addressing gender disparities.
-
Approximately 40% of adults in Ghana consumed sugar-sweetened beverages, 17% ate instant noodles and 14% ate packaged chips. Consumption of these foods is prevalent in both urban and rural areas, but significantly higher in urban areas.

Bar chart. In Tanzania, a significantly lower proportion of women than men consumed animal-source foods, pulses, nuts and seeds, according to the Diet Quality Questionnaire.
What's Coming Next
By 2022, the first Diet Quality dataset across 40 countries will be available. We envision the Gallup World Poll as the first step to demonstrate the value and feasibility of diet data collection -- and that longer term, the DQ-Q could be adopted for national-level diet monitoring.
Currently we are adapting the DQ-Q for more than 90 countries, with support from the U.S. Agency for International Development and The Rockefeller Foundation, as well as the European Union and BMZ through GIZ's Capacity for Nutrition (C4N). By mid- to late 2021, it will be possible to download preadapted, country-specific diet-quality survey tools. For many countries and projects, the public availability of these tools will enable the collection of dietary data that has been infeasible until now, and that covers aspects of diet related to both undernutrition and diet-related noncommunicable diseases.
In addition to their use in the Gallup World Poll, the Demographic and Health Surveys (DHS) will use these adaptations to fine-tune their MDD-W questions in each country. National governments may also integrate the DQ-Q into national household surveys or nutrition surveys. Furthermore, program implementers now will have a way to measure diet-quality indicators -- something that has been notoriously difficult and complex in the past, often requiring a staff member who is a nutritionist.
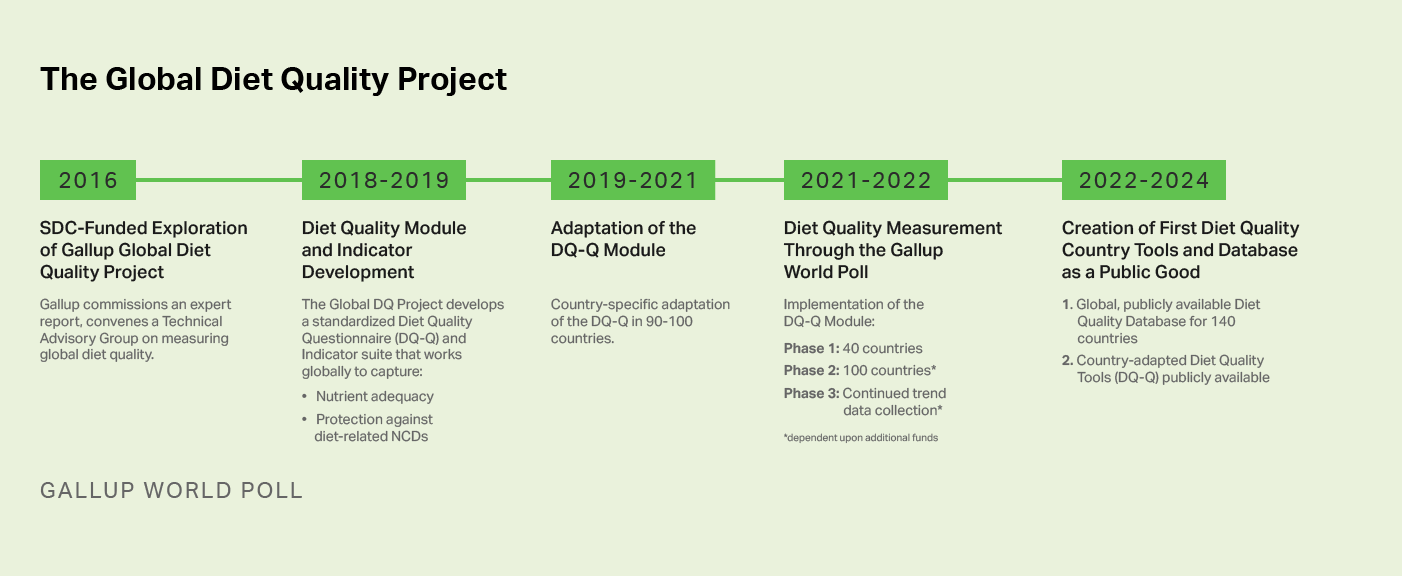
Timeline. In 2016, Gallup commissioned an expert report and convened a Technical Advisory Group on measuring diet quality. Between 2018 and 2019, the Global DQ project developed a standardized diet-quality questionnaire and indicator suite that work to capture nutrient adequacy and protection against diet-related NCDs. Between 2019 and 2021, the DQ-Q module was or will be adapted for 90 to 100 countries. Between 2021 and 2022, the DQ-Q module will be implemented in three phases. From 2022 to 2024, the database with data for 140 countries will be released.
The first steps of the Global DQ Project will be critical: providing an initial dataset for 40 countries and adapted diet quality questionnaire tools for over 90 countries. However, there is still more to be done. The project has proposed to scale up data collection to cover all countries, ideally for an additional two to five years to enable tracking of diet pattern trends.
Diet data have been a serious gap for decades. With multiple forms of malnutrition as a core factor within the Sustainable Development Goals and a priority of the U.N. Decade of Action on Nutrition; with diet-related noncommunicable diseases on the rise; and with unpredictable shocks to diets such as COVID-19, there has never been a more important time to measure diet quality. The Global Diet Quality Project is generating the essential tools and data to do that.
*Editor's Note: These figures were revised after the article initially published.
Footnotes
[1] GBD 2017 Risk Factor Collaborators. Global, regional, and national comparative risk assessment of 84 behavioural, environmental and occupational, and metabolic risks or clusters of risks for 195 countries and territories, 1990-2017: a systematic analysis for the Global Burden of Disease Study 2017. Lancet 2018;392(10159):1923.
[2] Herforth, A., Martínez-Steele, E., Calixto, G., Sattamini, I., Olarte, D., Ballard, T., & Monteiro, C. 2019. Development of a Diet Quality Questionnaire for improved measurement of dietary diversity and other diet quality indicators (P13-018-19). Current Developments in Nutrition, 3(Supplement_1), nzz036-P13. https://doi.org/10.1093/cdn/nzz036.P13-018-19
[3] Herforth, A.W., Wiesmann, D., Martínez-Steele, E., Andrade, G., & Monteiro, C.A. Introducing a suite of low-burden diet quality indicators that reflect healthy diet patterns at population level. Current Developments in Nutrition, In press.
[4] FAO and FHI 360. (2016). Minimum dietary diversity for women: A guide to measurement. FAO: Rome. https://www.fao.org/3/a-i5486e.pdf (PDF download).
[5] These GWP data were used to highlight gender disparities in diet quality in the United Nations State of Food Security and Nutrition in the World 2020 report.