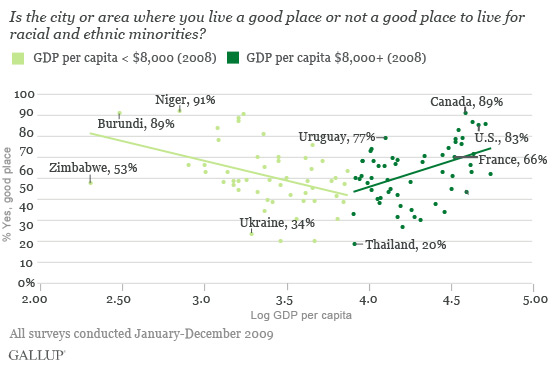
WASHINGTON, D.C. -- The rising income inequality that often accompanies rapid economic growth can often mean certain minority groups are disproportionately likely to be excluded from new economic opportunities. Gallup data indicate that among the world's poorer countries, residents are less likely to see their communities as good places for racial and ethnic minorities as GDP increases. Among countries with average annual incomes above $8,000, however, higher GDP levels are linked to more widespread perceptions of minority acceptance.

Residents of Canada (89%) and the U.S. (83%) are among the most likely in the world to say their communities are good places for racial and ethnic minorities, as are residents of Niger (91%) and Burundi (89%). The former two countries are among the richest in the world, while the latter two are among the poorest. Among countries in the middle of the GDP spectrum, however, the proportion rarely rises above 70%.
These findings are based on Gallup surveys in 109 countries in 2009. The U-shaped pattern is reminiscent of an economic theory known as the Kuznets curve, which argues that income inequality tends to increase in the early stages of a country's economic development until average income reaches a certain level, after which it tends to decline.
Economists offer various theories on why inequality may start to decrease when a country's economy rises above a certain GDP level. One of the most common ideas is that at some point in a country's economic growth, pressure builds to implement institutional reforms that allow more people to participate in the growth process; for example, by establishing secure property rights or basic education for all citizens. Inclusiveness becomes greater as these institutions develop, leading to stronger growth.
This idea implies that countries where rapid growth is occurring and GDP levels are in the "turnaround" range may be prone to instability if they are not taking steps to provide all residents with economic opportunities.
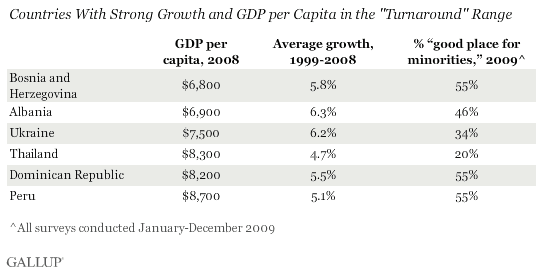
Gallup's data suggest a parallel effect may apply to perceived opportunities for racial and ethnic minorities. As noted, the turnaround range in the previous graph is about $8,000 in GDP per capita, or about 3.9 in log GDP per capita. (This article uses GDP figures from 2008 to avoid having to account for the effects of the global recession.) Countries in the $6,000 to $10,000 range with average annual growth of at least 4% from 1999 to 2008 are listed in the graph below.

In two of the countries on this list -- Ukraine and Thailand -- respondents were particularly unlikely to say their communities were good places for racial and ethnic minorities. Each country has struggled with prolonged political and social instability in recent years. Though they were not asked about racial and ethnic minorities in 2009 (and so are not included in this analysis), Egypt and Tunisia also fell into this GDP range in 2008, and both averaged about 5% growth between 1999 and 2008, suggesting perceptions of inclusiveness were particularly relevant in those countries prior to their revolutions.
Implications
Social inclusiveness is likely to be increasingly important as all countries come to rely more heavily on the productivity and innovation of their "human capital" for long-term economic development. Countries that are in the early stages of growth -- whether from natural resources, infrastructure development, or other means -- should recognize that maintaining that growth over the long term is likely to require harnessing the talents and energy of all social groups. As the reform movement sweeping the Arab world has demonstrated, if leaders are unable or unwilling to find ways to translate their growth into inclusive economic opportunities, they may risk having change forced on them from within.
For complete data sets or custom research from the more than 150 countries Gallup continually surveys, please contact SocialandEconomicAnalysis@gallup.com or call 202.715.3030.
Survey Methods
Results are based on face-to-face and telephone interviews conducted in 2009 with approximately 1,000 adults, aged 15 and older, in each of 109 countries. All global regions are included in the analysis with the exception of one: in the Middle East and North Africa region the "good place for minorities" question was not asked in 2009. For results based on the total sample in each country, one can say with 95% confidence that the maximum margin of sampling error ranges from ±1.7 percentage points to ±5.7 percentage points. The margin of error reflects the influence of data weighting. In addition to sampling error, question wording and practical difficulties in conducting surveys can introduce error or bias into the findings of public opinion polls.